Let me ask you…
When you first started trading, what were some of the first things you learned?
Candlesticks.
Moving averages.
Range and trending markets.
And yes, they are important topics for a beginner…
But as trading piques your interest, what happens?
You want more!
You start to look into more complicated topics, such as Elliot waves…
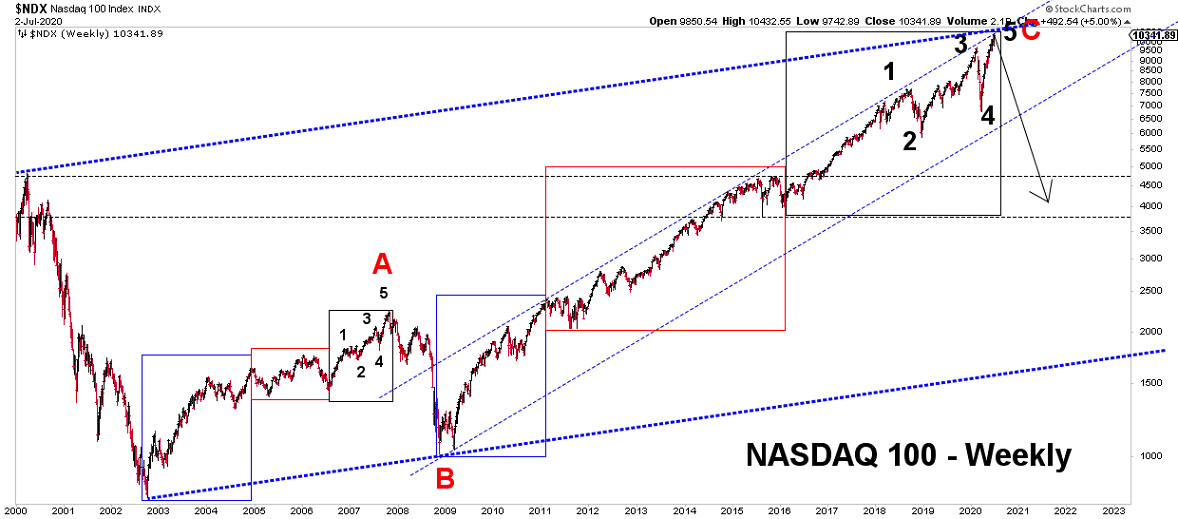
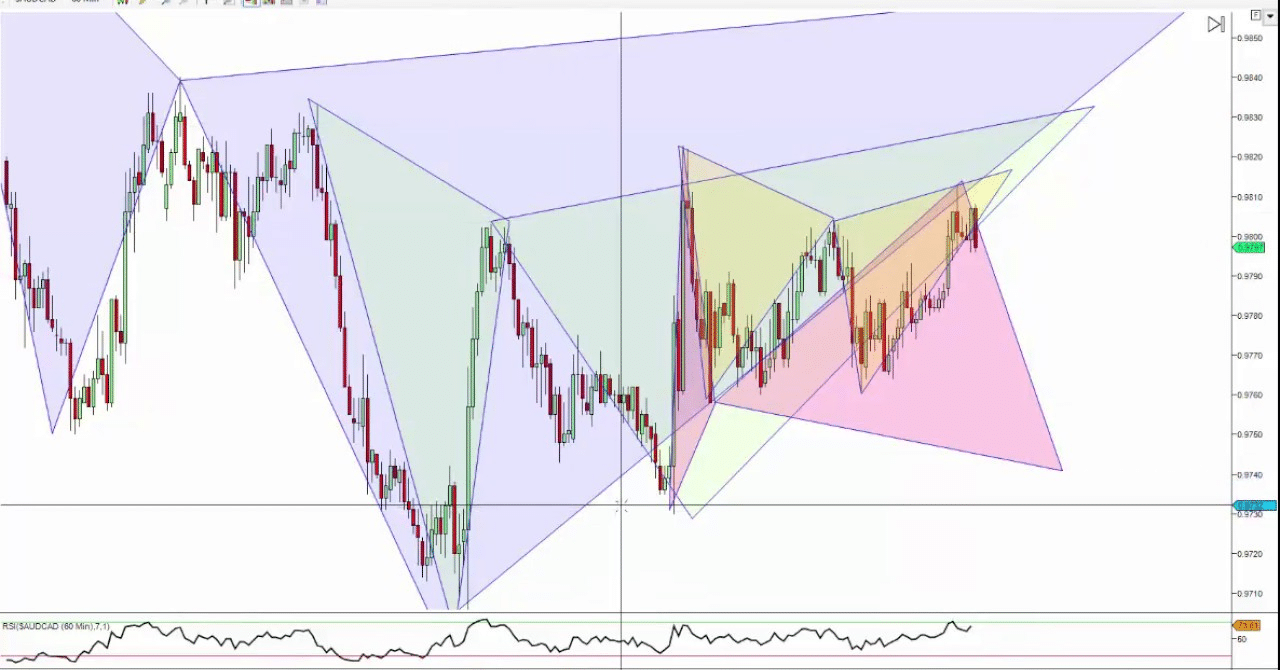
Advanced chart patterns…
Source: Trading Empowered
And, of course, divergence trading…
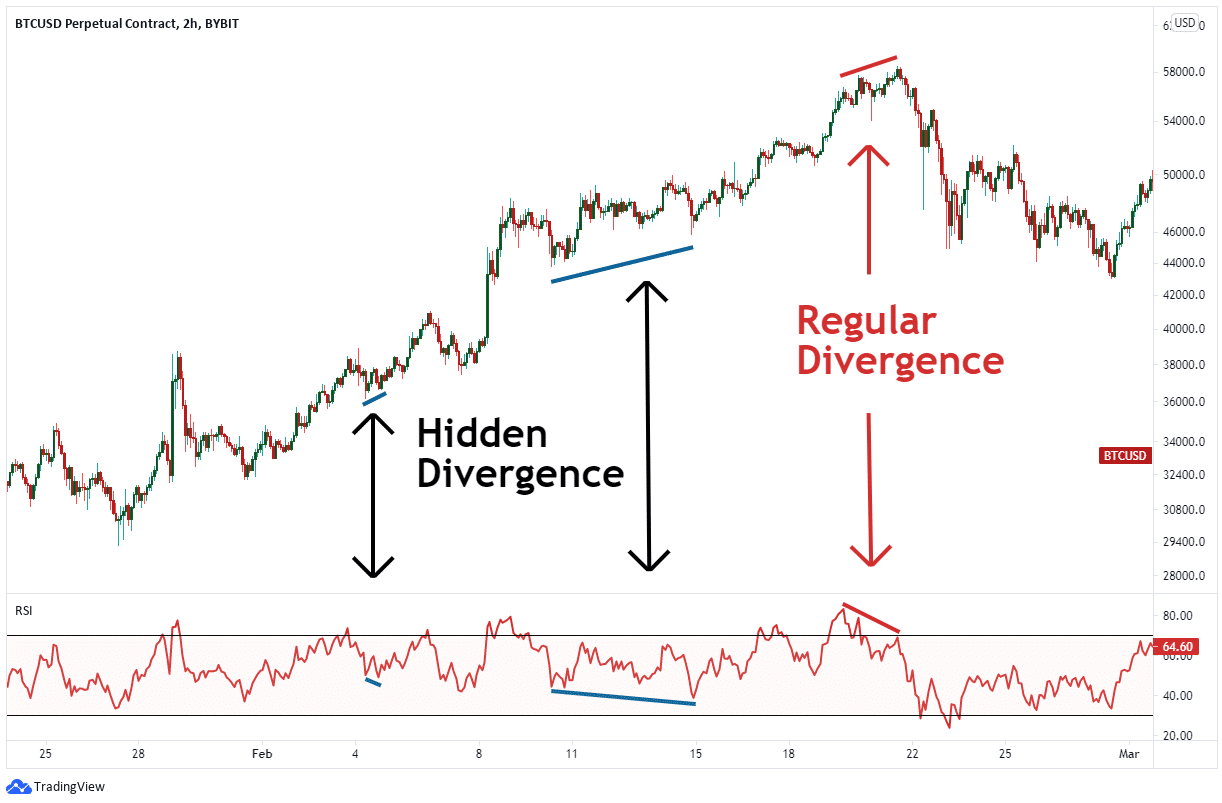
Source: By bit
At this point, you’ve maybe taken a peek into those topics.
But I bet you’re still wondering:
“How do I use it to trade the markets?”
“How do I time my entries, stop loss, and take profit levels?”
Well, that’s why in today’s guide…
I’ll give you the complete picture of what it’s like to master divergence trading!
Specifically, you’ll learn:
- The “hidden” principle behind divergence trading that no other textbook will tell you
- A fool-proof technique that will help you master identifying all types of divergences in trading
- Which indicator is the best for divergence trading (it’s not what you think)
- A complete and simple divergence trading strategy (including entries and exits)
- Mistakes to avoid when trading divergences and solutions to overcome those mistakes
This is a jam-packed masterclass guide.
So…
I suggest you get your notes and charts up and let’s get started!
What is divergence trading and how does it work? (it’s not what you think)
To put it simply…
A “divergence” in trading happens when the swing highs/lows on your chart are different from the swing highs/lows shown in your indicator…
And there can be a lot of variations of them, as seen in this cheatsheet!…
Now, here’s the thing…
The market consists of buyers and sellers, correct?
That’s why you want to ask:
How does divergence trading work?
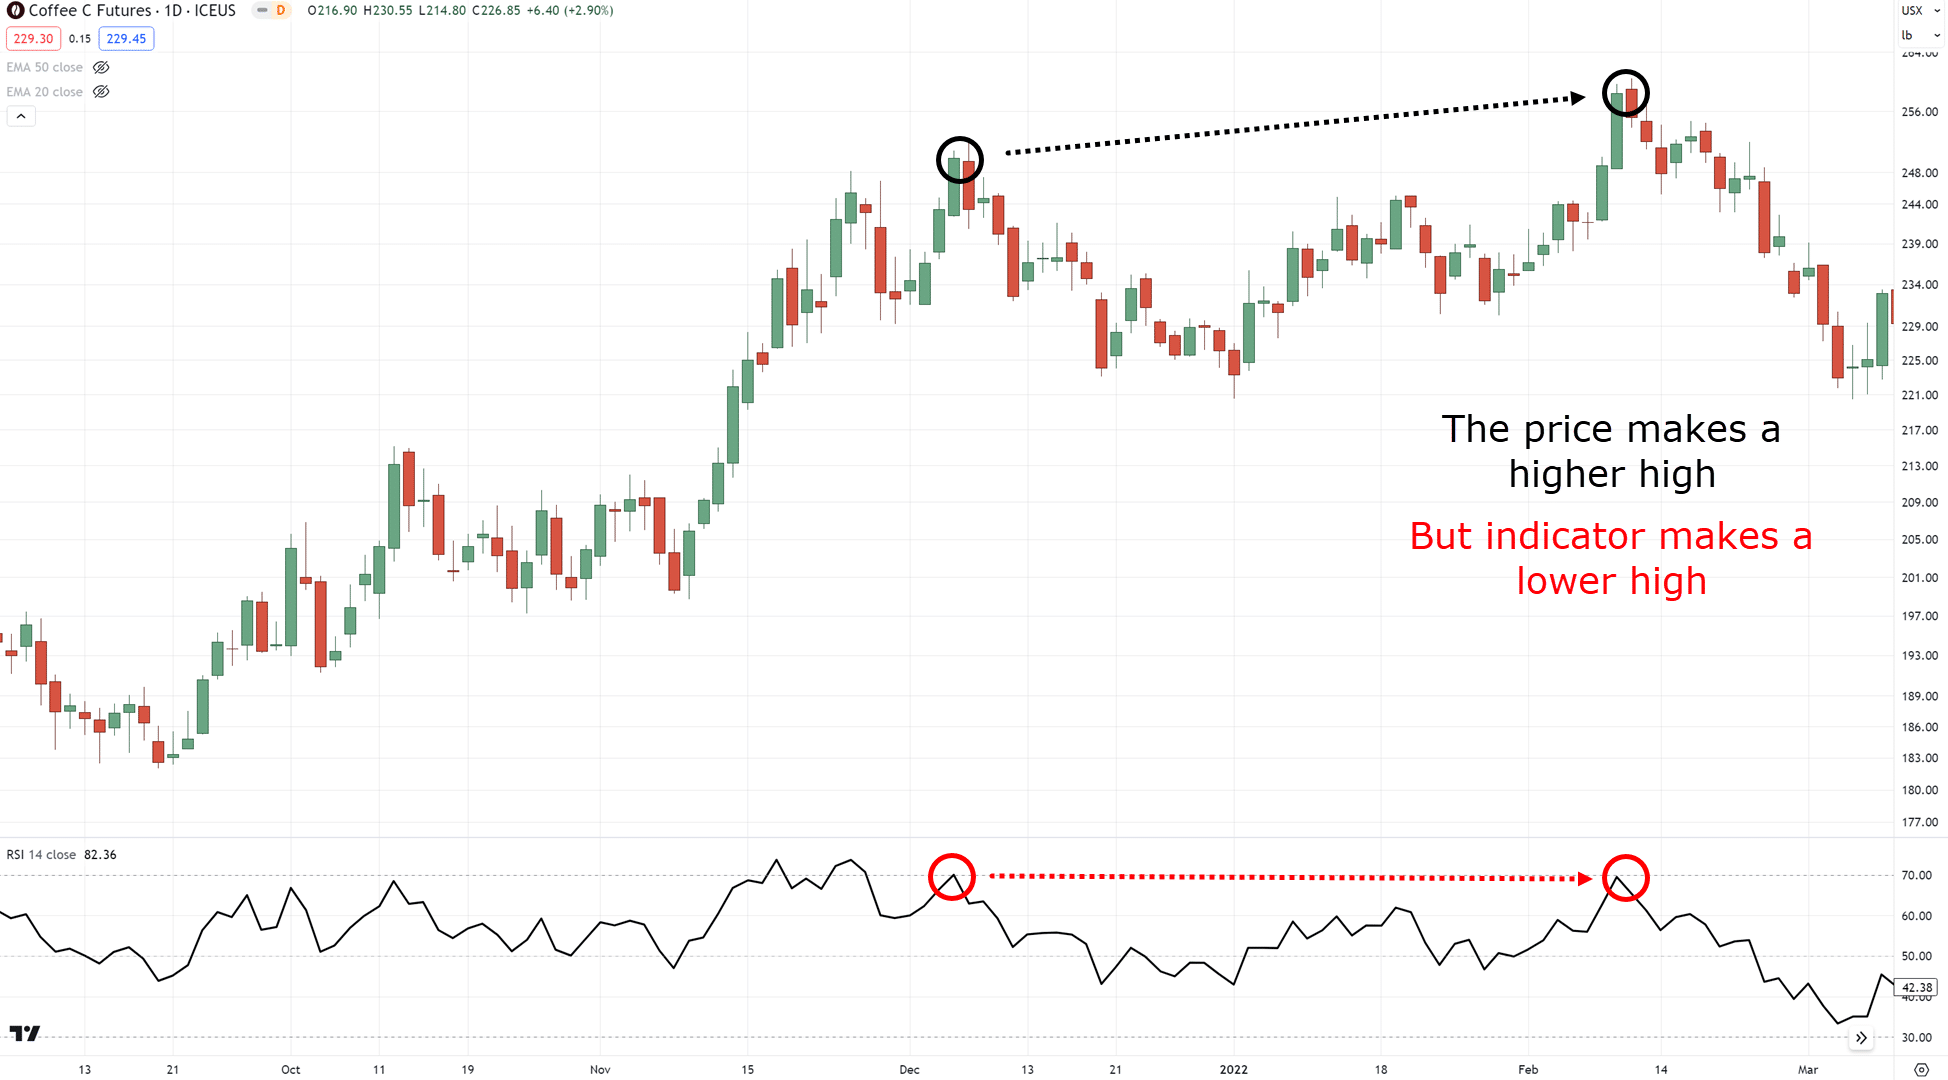
If you ask someone how divergences work, they’ll probably say…
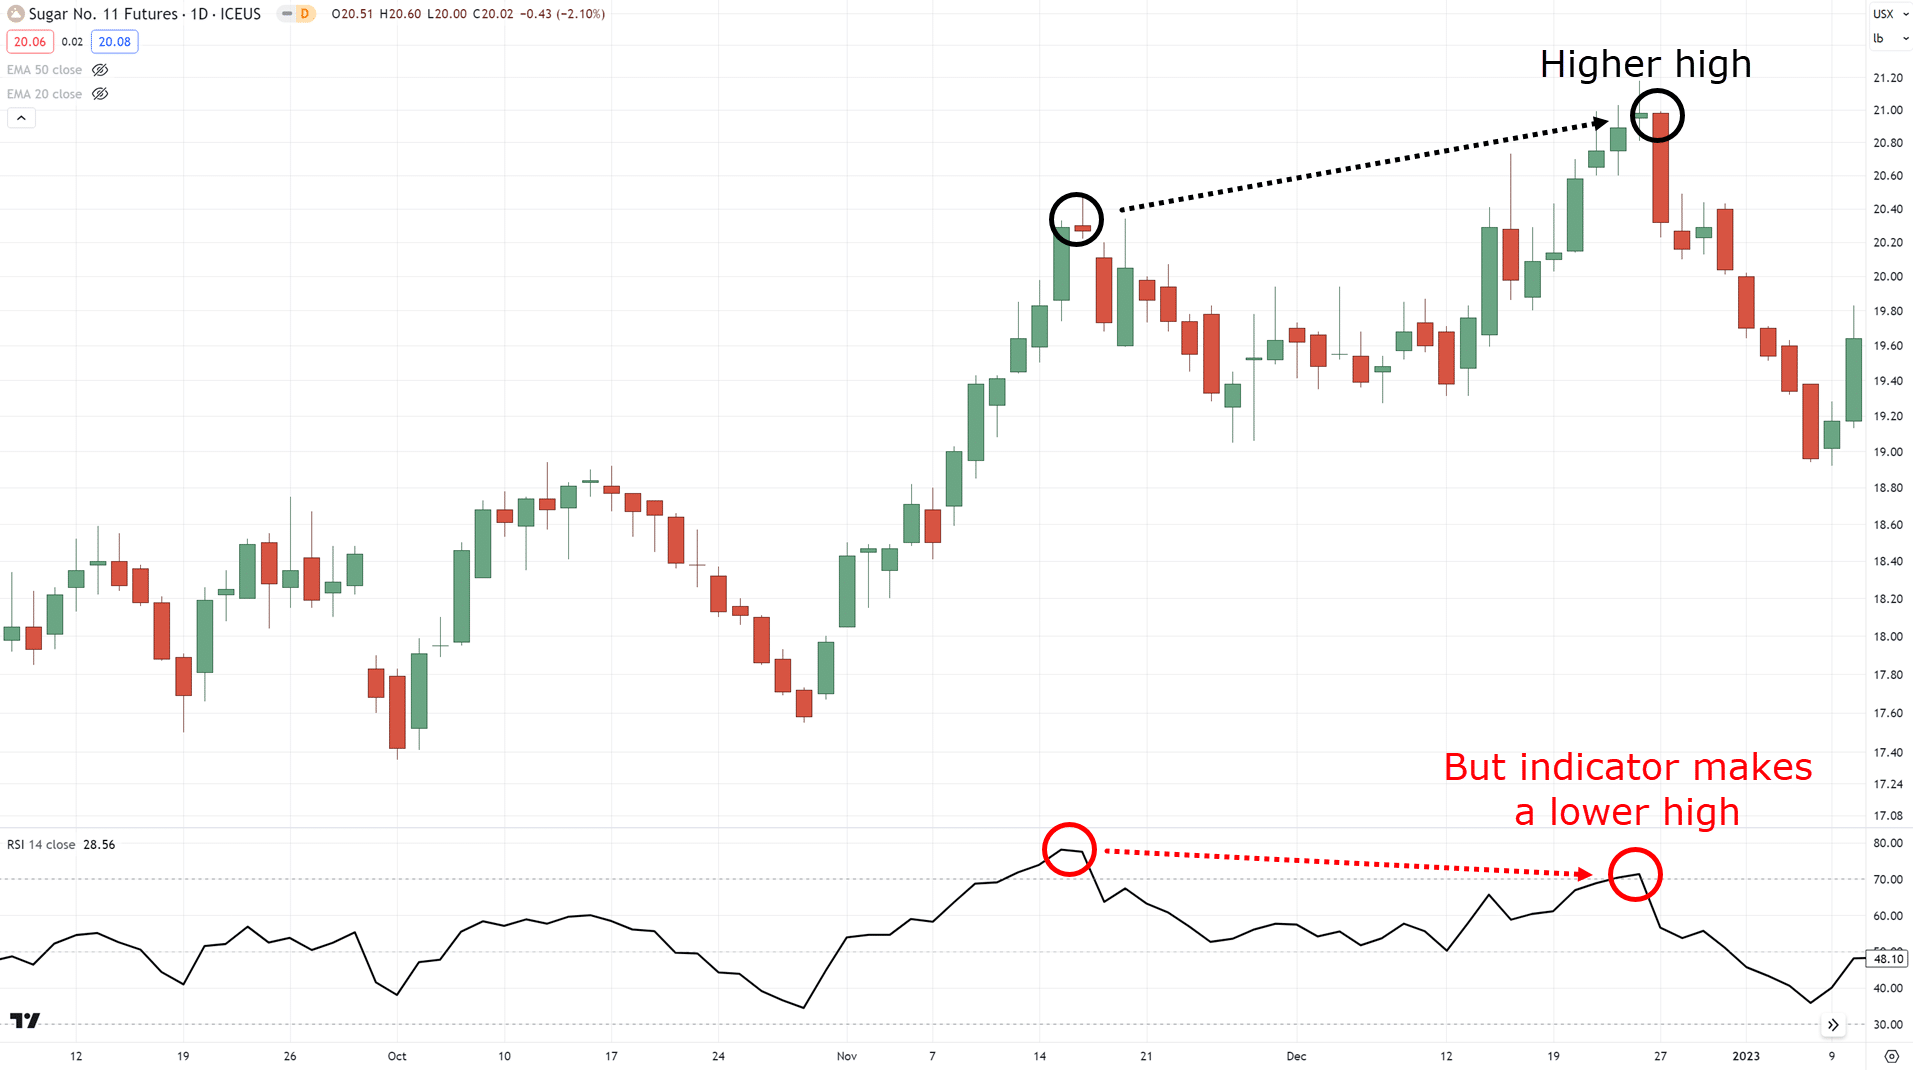
“Oh, divergences in trading are when the price makes a higher high, but the indicator makes a lower low”
And sure, that’s the textbook definition.
But what does it actually mean?
What are the buyers and sellers doing specifically when divergence happens?
What does your indicator represent?
Let me tell you…
Imagine you’re on a running track, and you’re ready to begin a 100-meter dash.
Once the gunshot pops…

You sprint and make it to the finish line in just 9 seconds!

Holy cow, you’re pretty fast!
Now…
Imagine you make the same 100-meter dash, but this time you are being pushed back by a hurricane wind just to finish the race

What do you think would happen?
Surely, you’ll finish the race twice as long with this rain and wind!

So, how does this relate to divergence trading?
Simple!
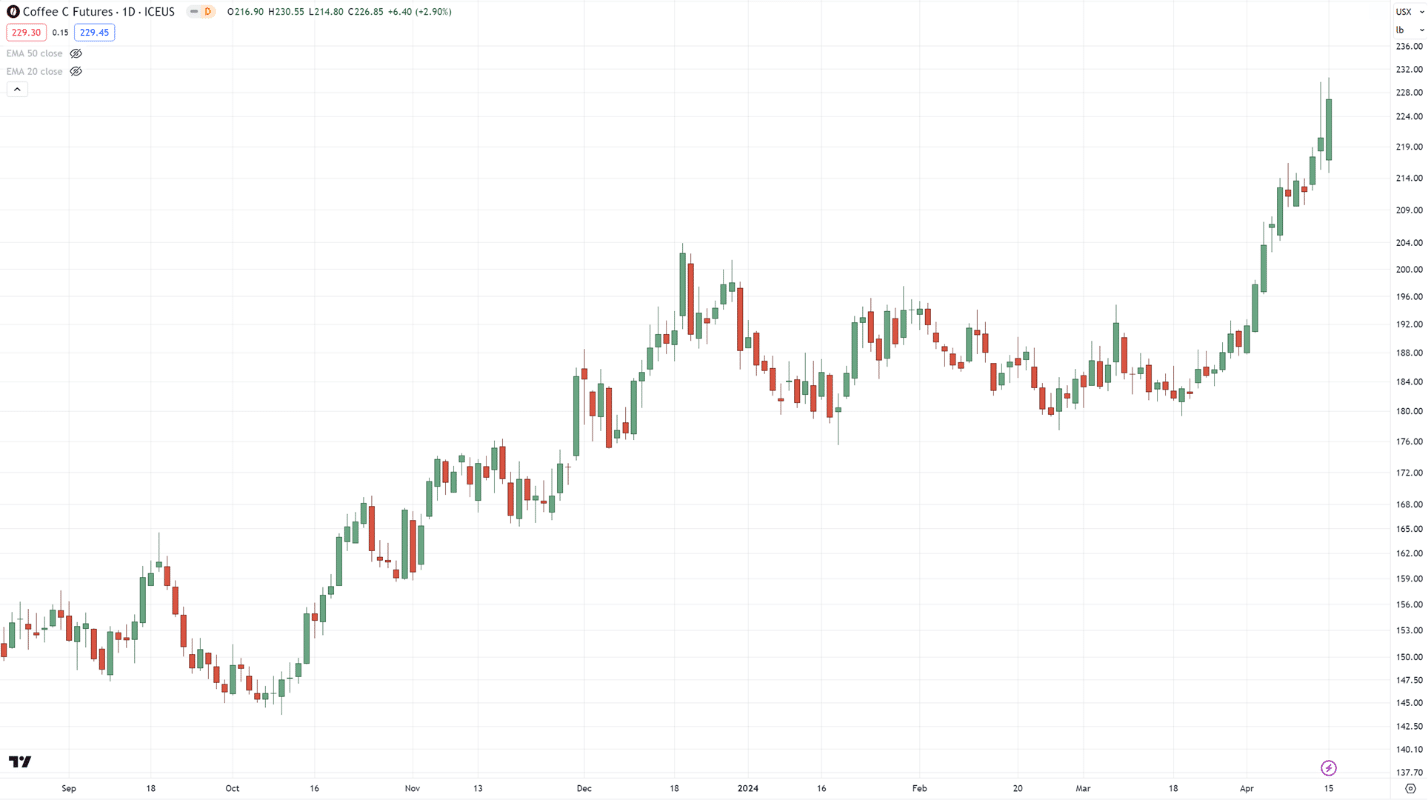
There are times when the market can make a +16.65% gain in just 13 days, phew!

On the other hand, you can see how Sugar struggled to make +11.17% within 19 days…

This difference in momentum is a divergence!
Even though the buyers were able to reach a +11% gain…
…you can see that they struggled to get there!
In turn, this can tell you the buyers aren’t as strong as you might think…
Now you might be wondering:
“In that case, we can spot these easily on our charts anyway, right?”
“Why do we even need an indicator?”
The answer is that charts can be manipulated.
Not by institutions or brokers, that’s not what I mean!
What I mean is that your charts can look different depending on…
…whether you are on a computer…
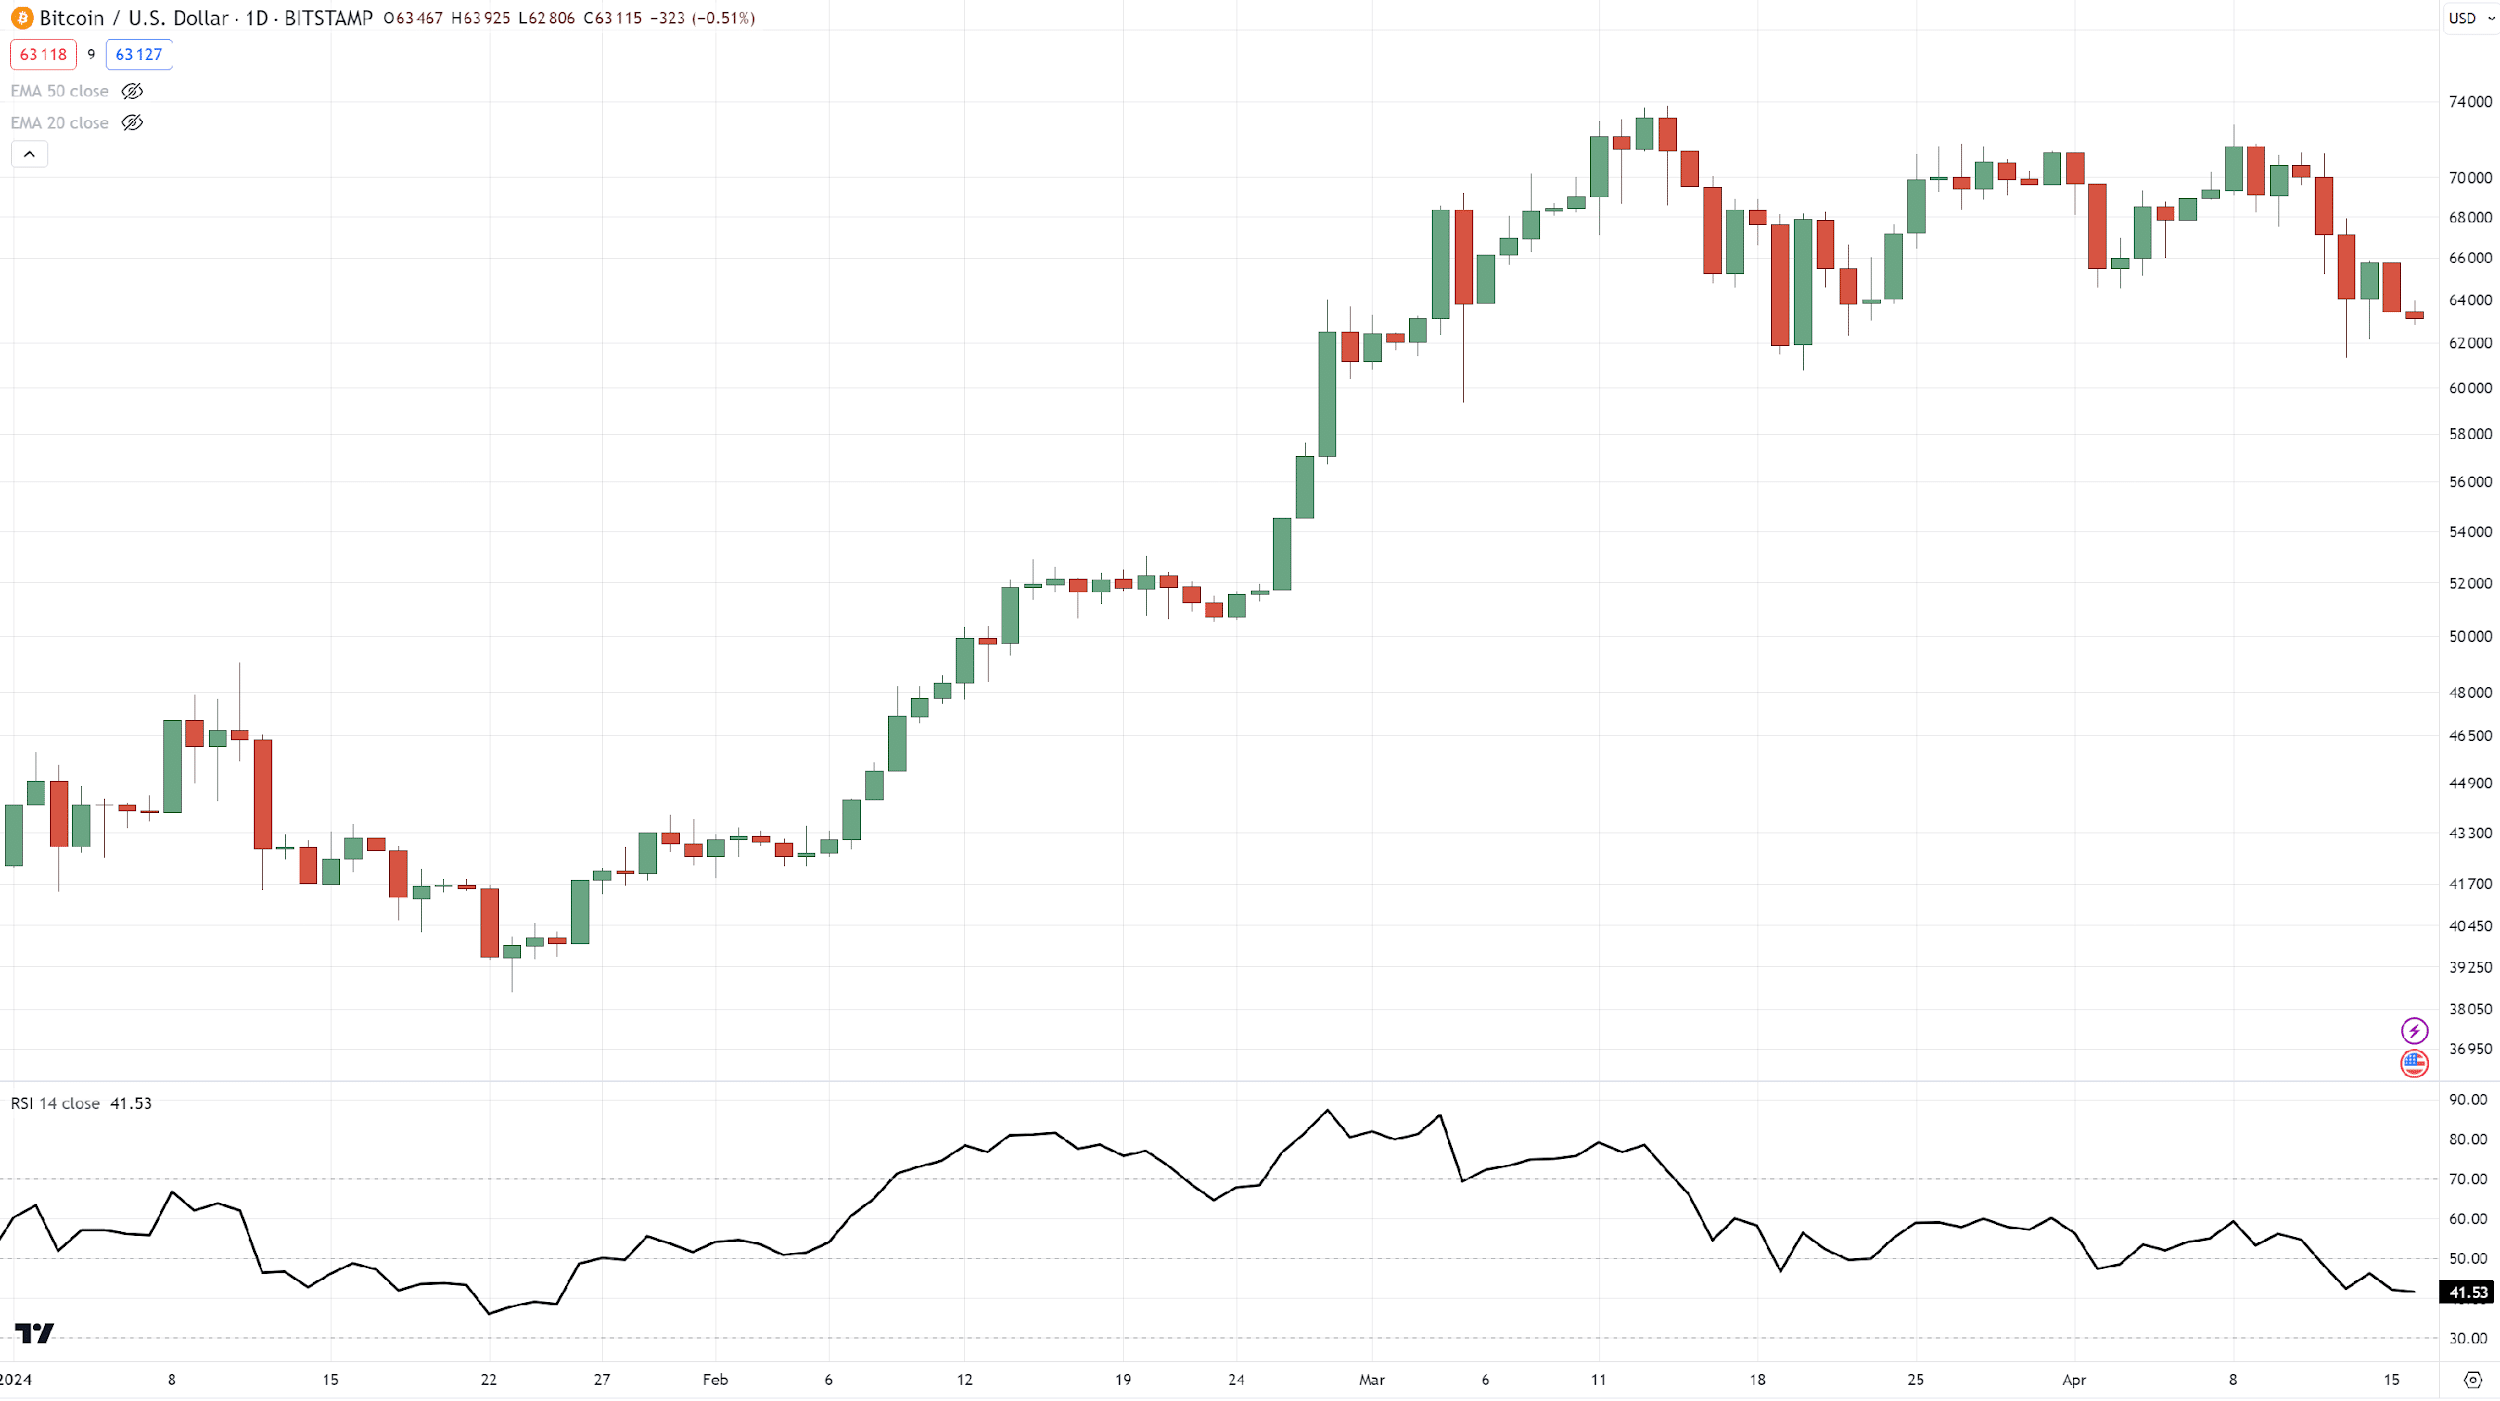
… or on a mobile phone…
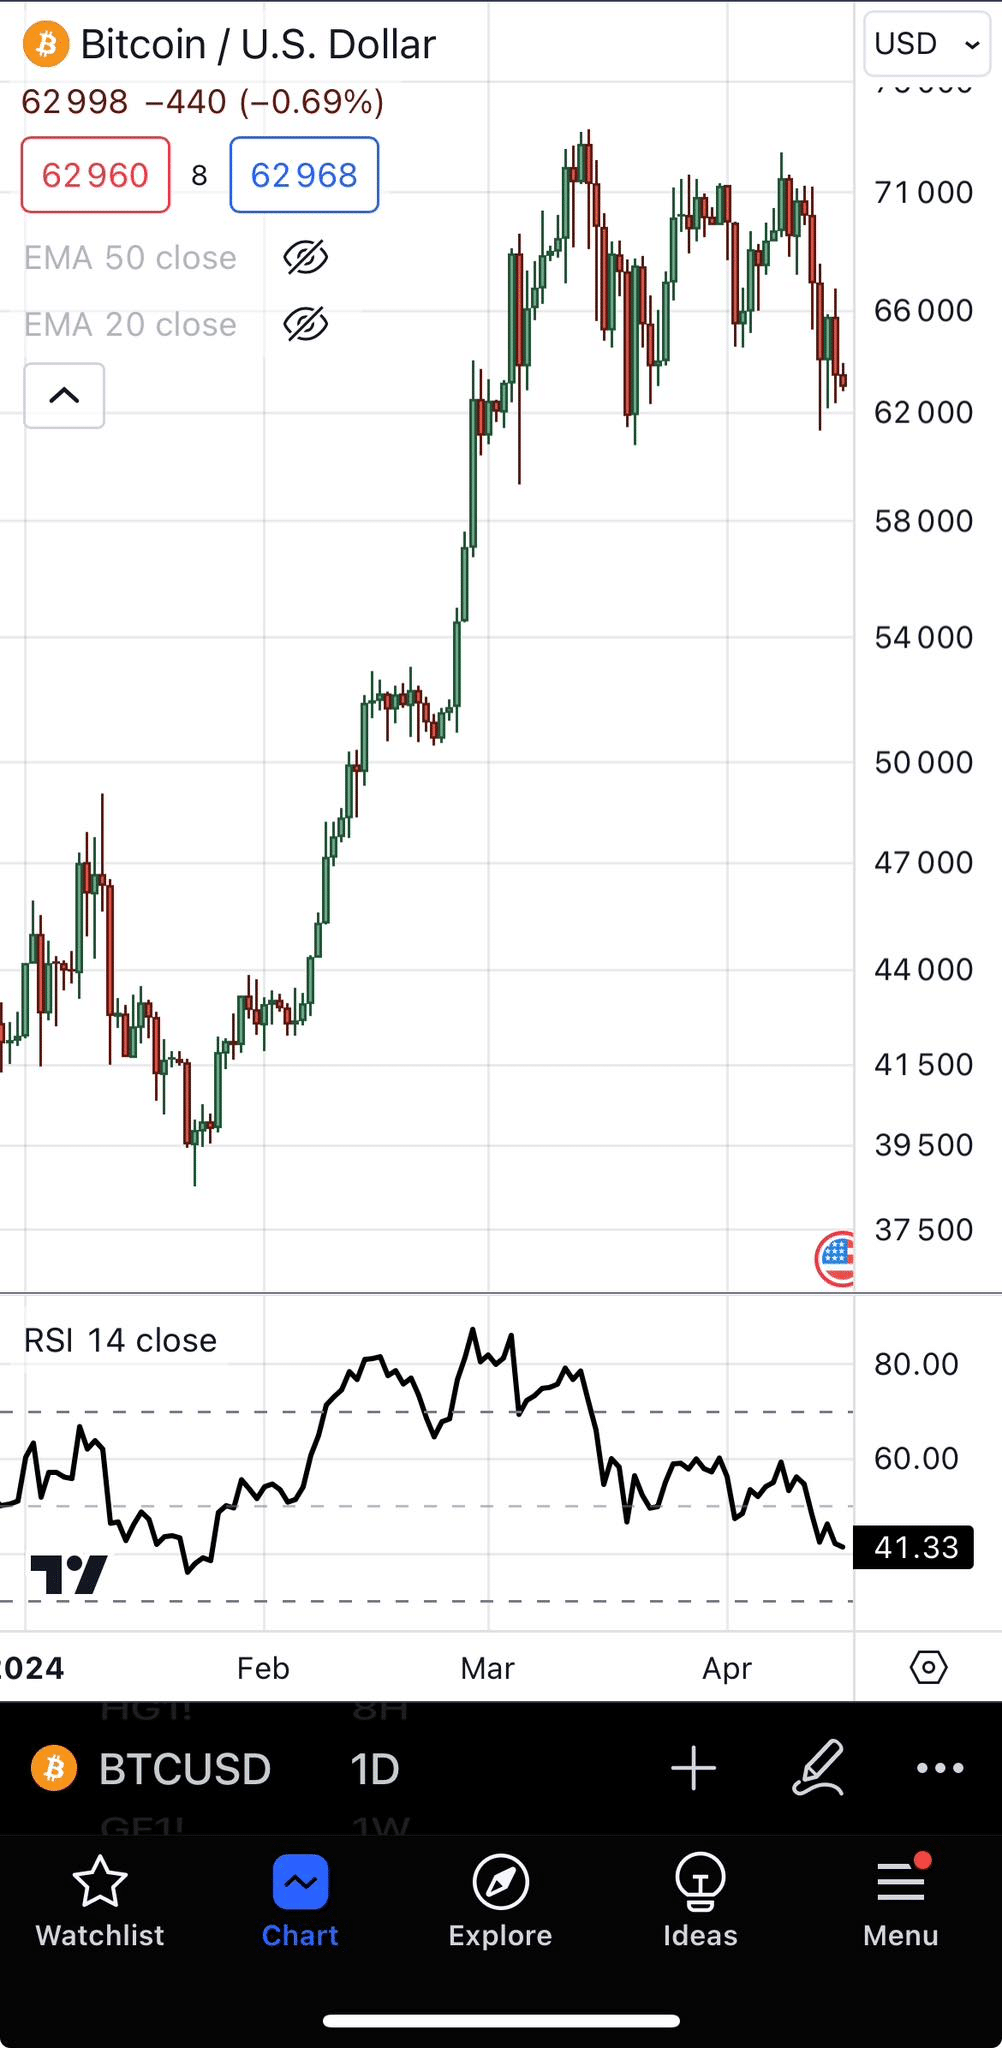
…if your chart is in logarithmic…

…or non-logarithmic scale…

…the appearance can be extremely varied.
But with an indicator – things remain the same, regardless!…

This means that your indicator can act as an extra set of eyes when detecting market divergence.
Which now leads to the next question…
How do you spot divergence trading?
Because surely…
What’s written in a textbook rarely matches up with real-time markets, agree?
That’s why in the next section I’ll share with you proven tips to help you spot divergences better and more accurately.
Read on!
Master this trading skill first when using a divergence trading strategy
Here’s the truth:
Spotting divergence trading takes practice.
And the best skill to start nailing down first is:
Learning how to spot market structures
Here’s what I mean…
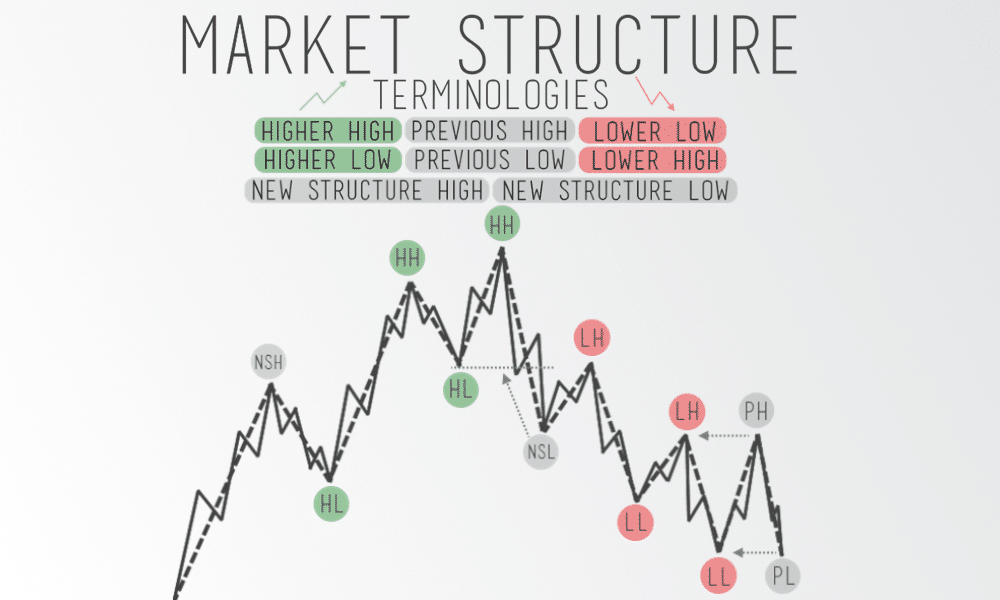
As you can see, price action in the market can make the following:
- Higher highs
- Higher lows
- Lower lows
- Lower highs
And learning how to spot those is key to mastering divergence in trading!
Fortunately…
I’ve made a comprehensive trading guide dedicated to you, which you can check out here:
How to Read Price Action (For Dummies)
But in the meantime…
Let’s have a quick exercise, shall we?
Looking at these charts, can you plot where the swing highs and lows are?…
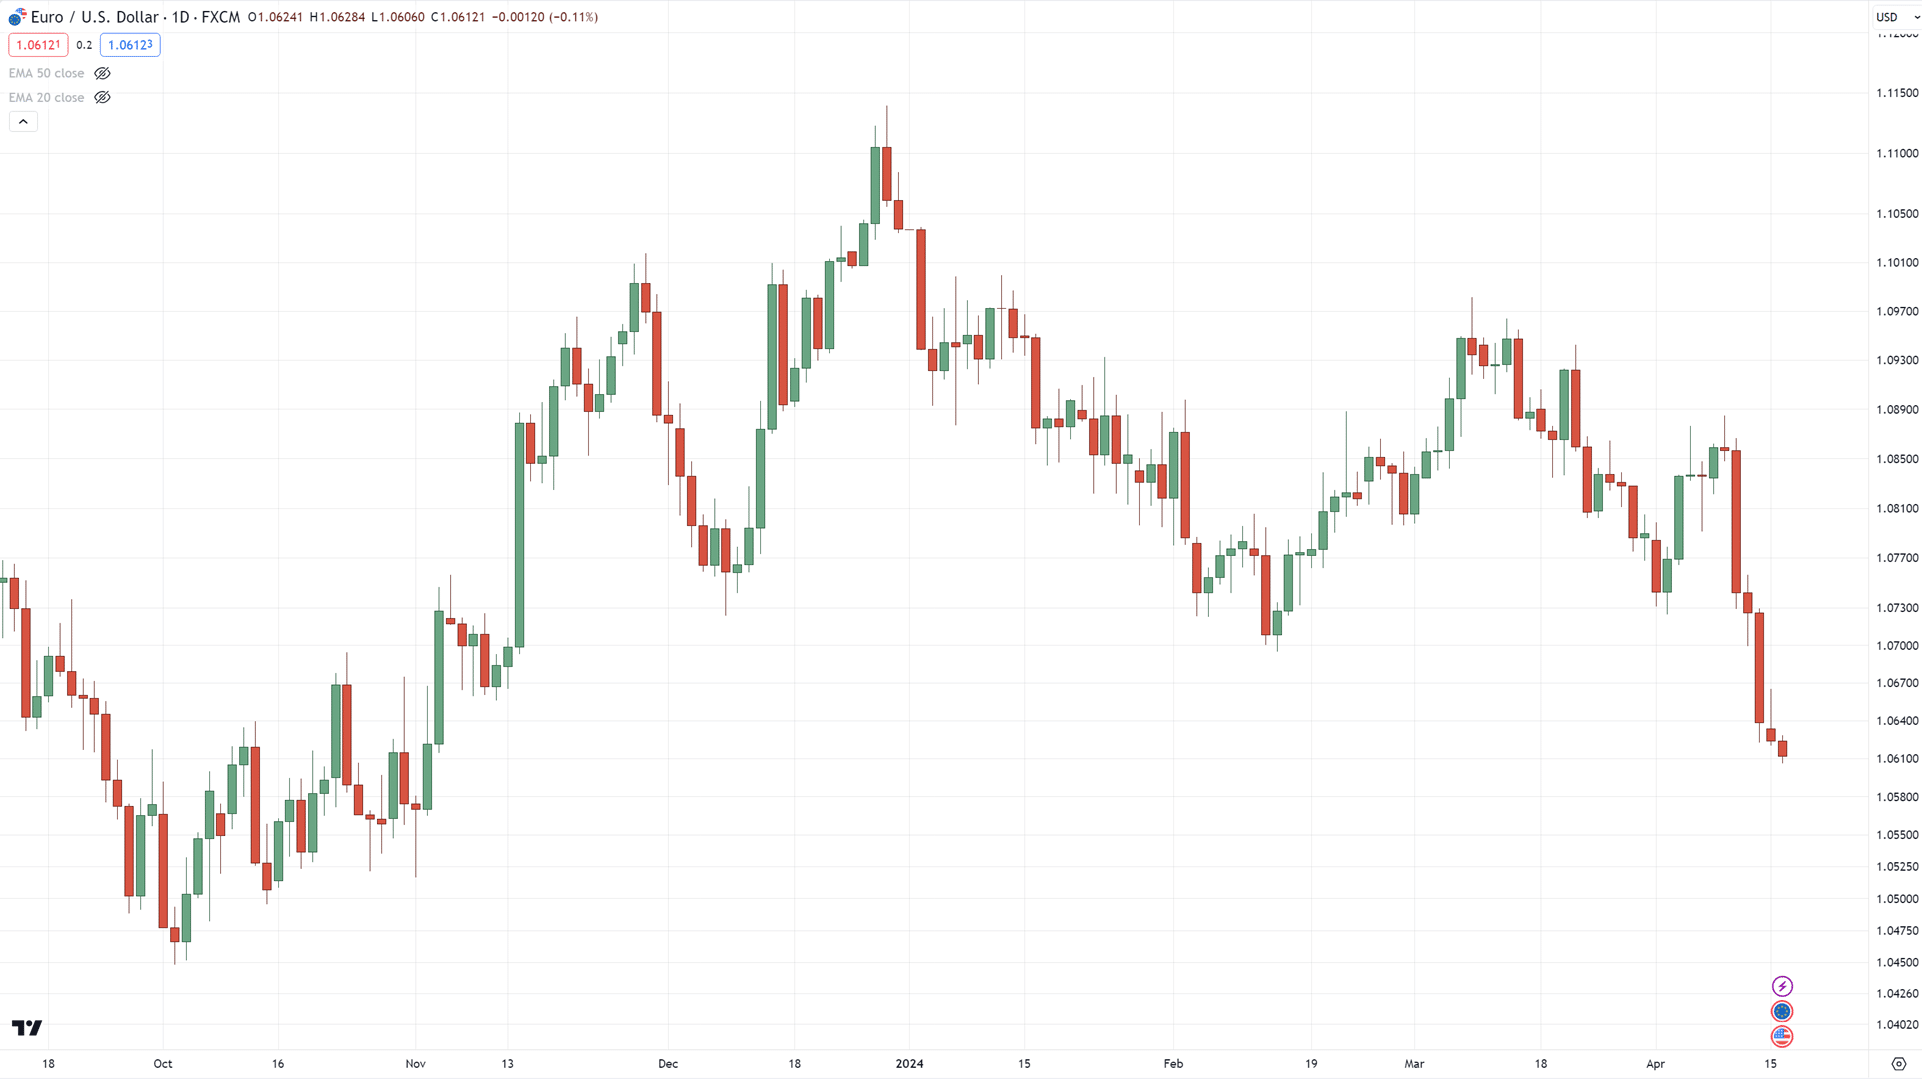
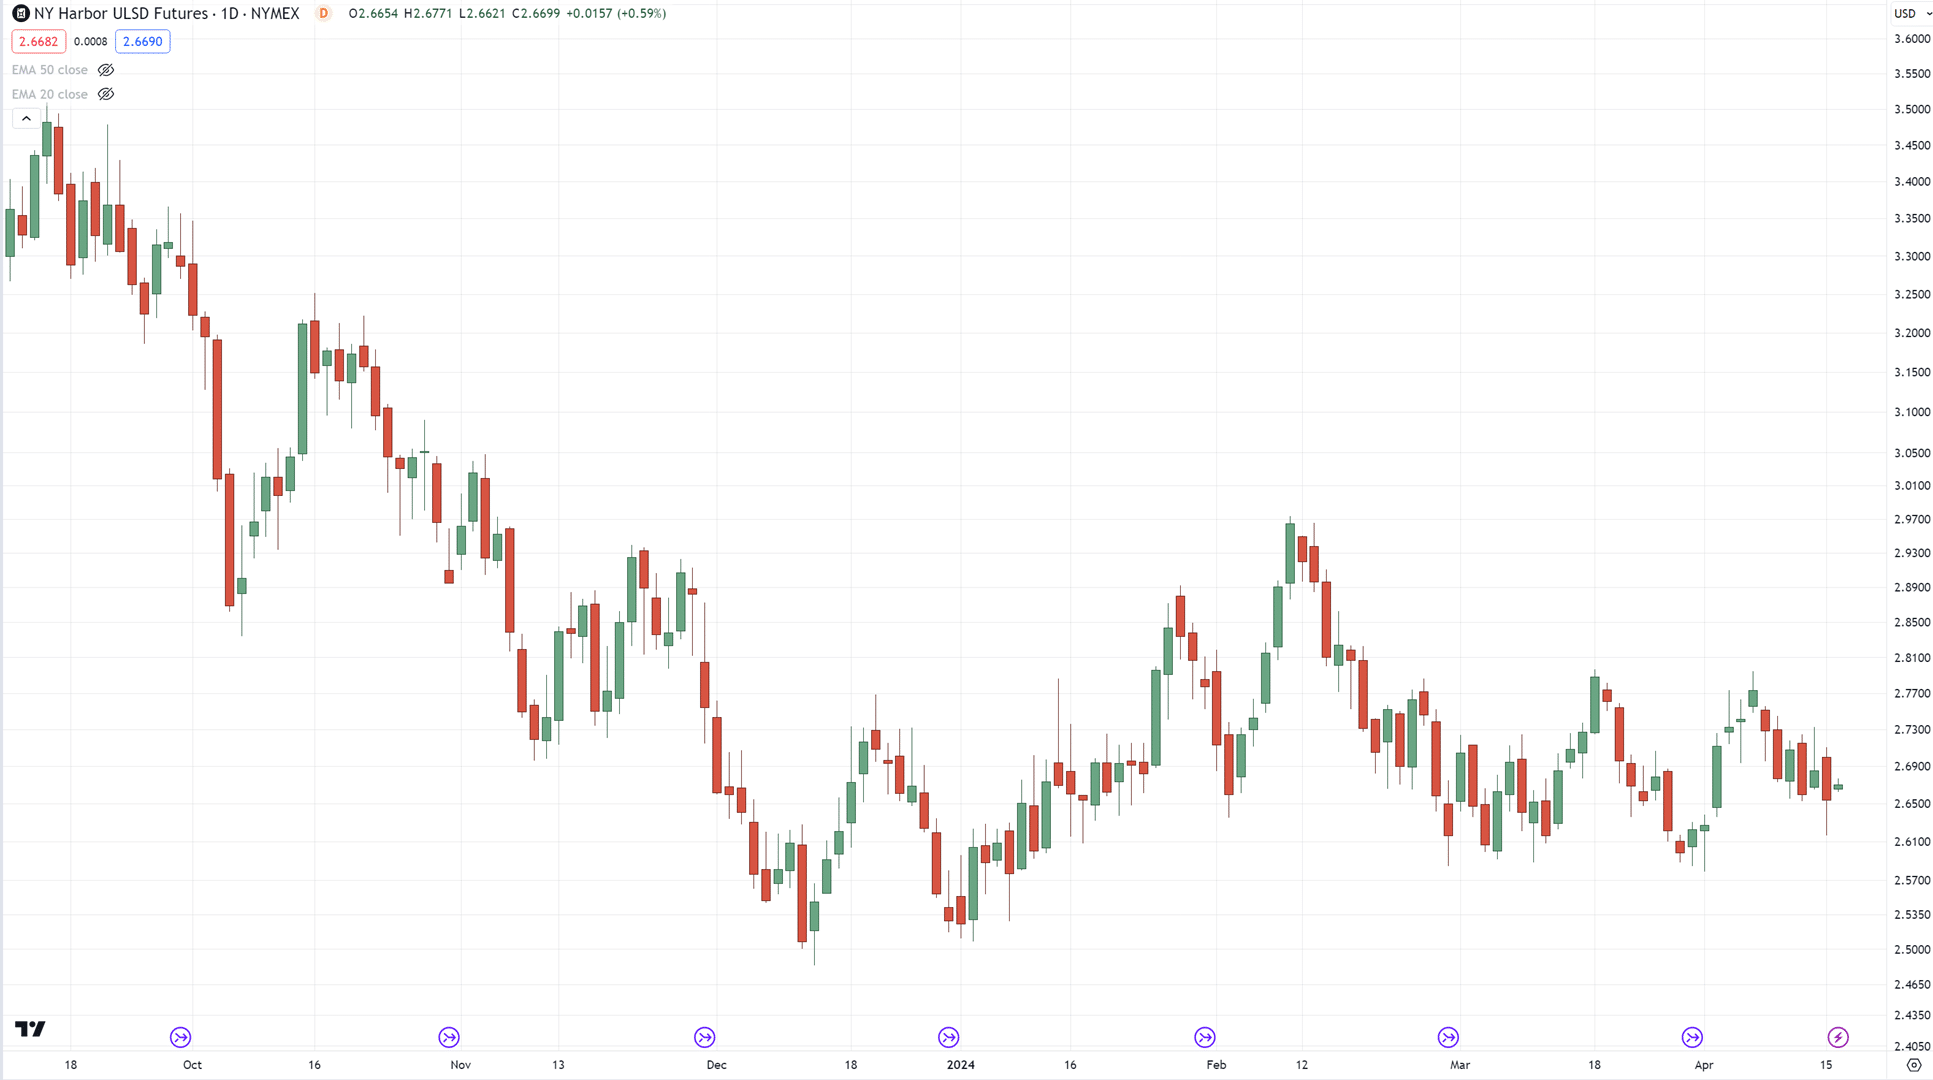
All done?
Ready to see the answer?
Well, here you go…
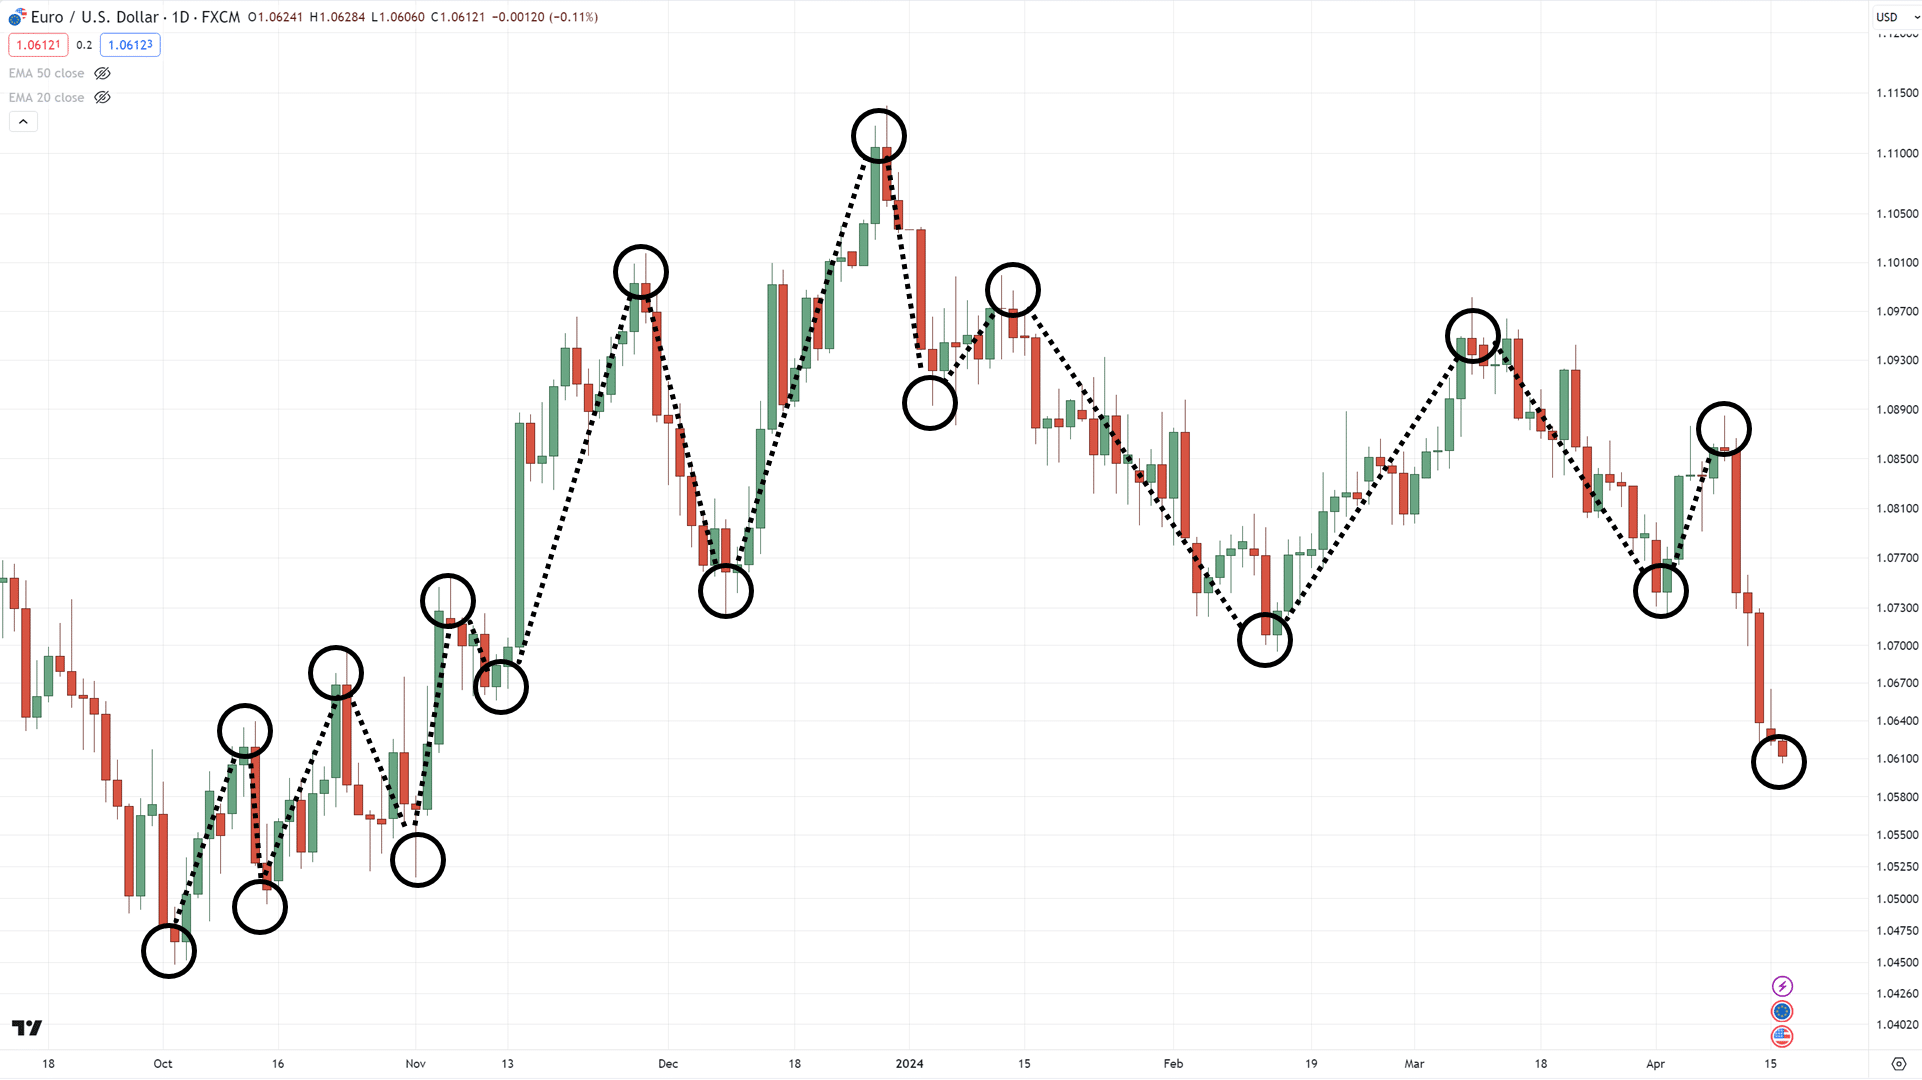
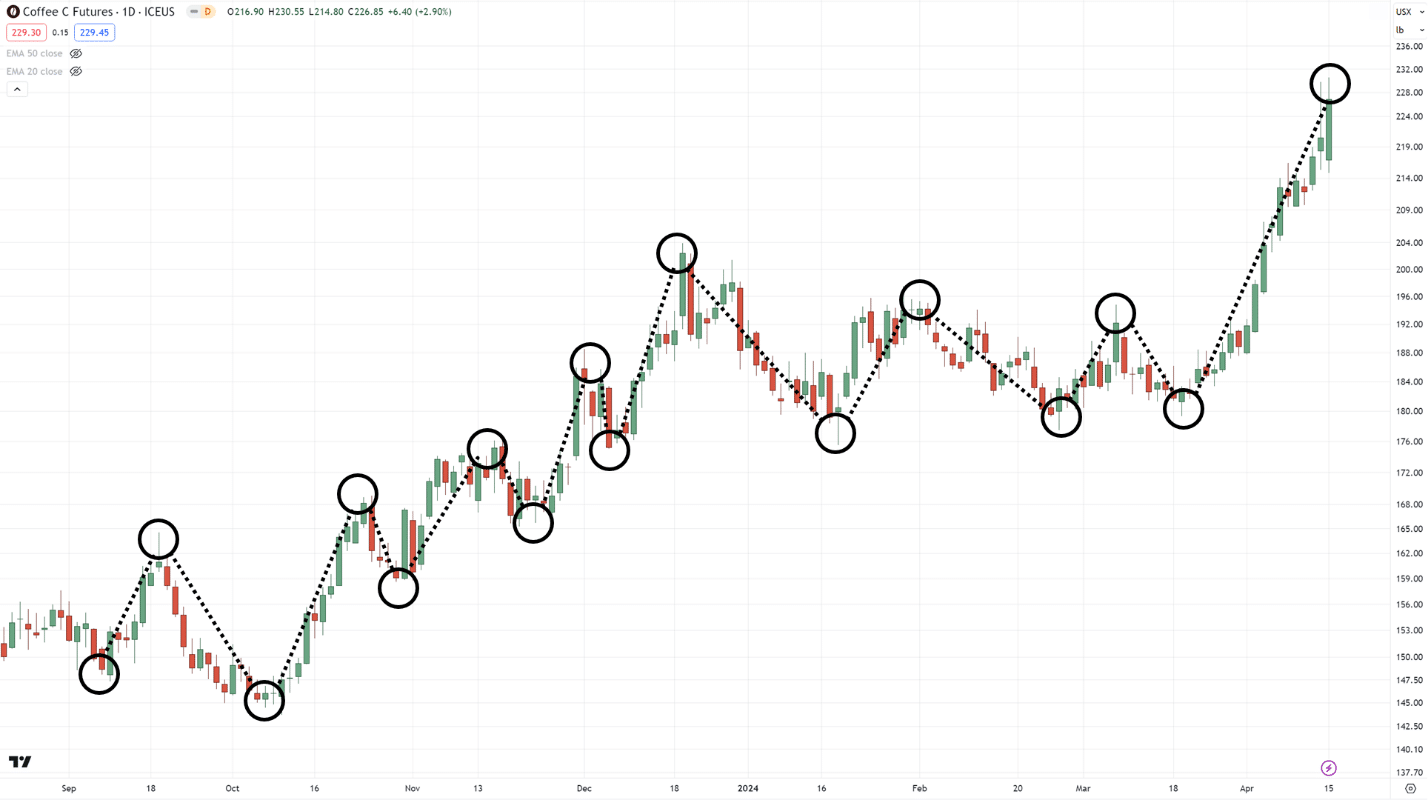
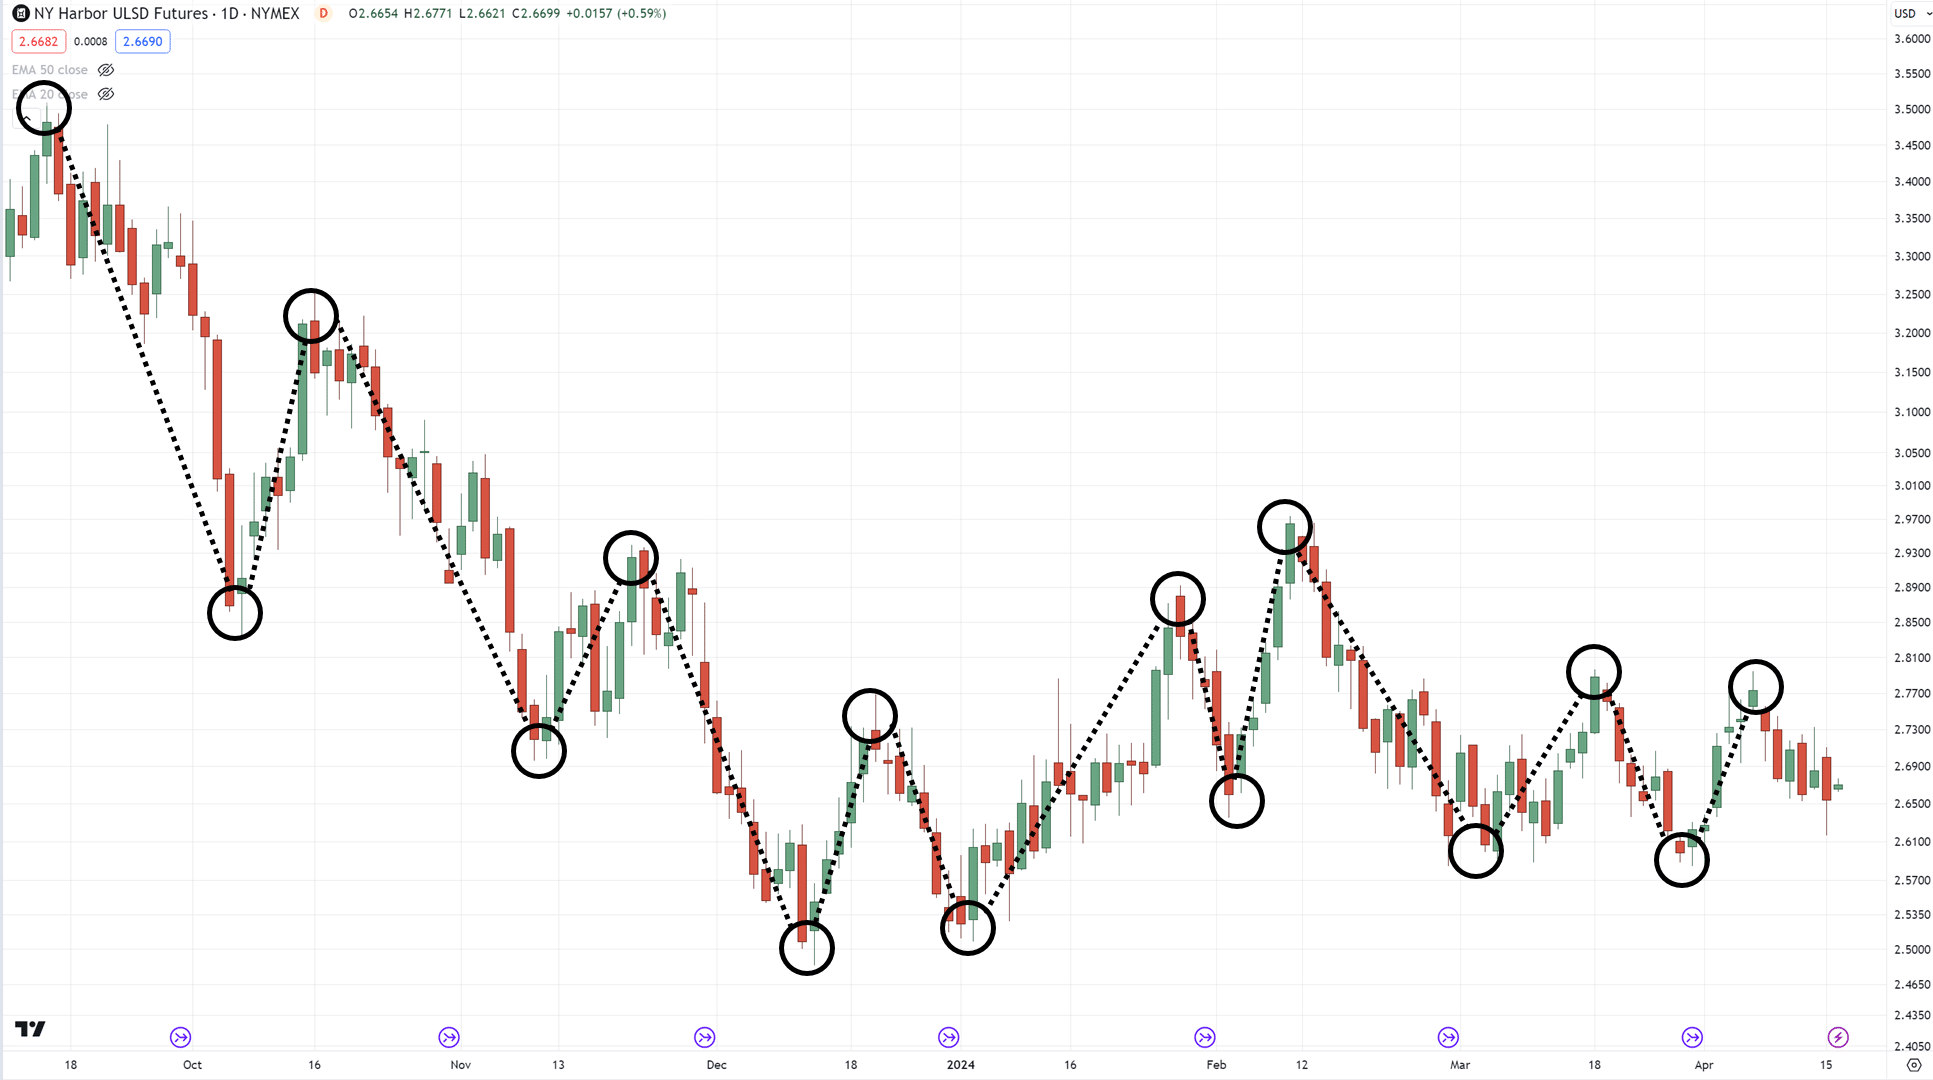
The best part is that yours doesn’t have to match mine 100% all the time.
…and you don’t have to plot all of them down to the smallest detail!
Got it?
But if you want something more consistent to start with, you can check out the zigzag indicator…
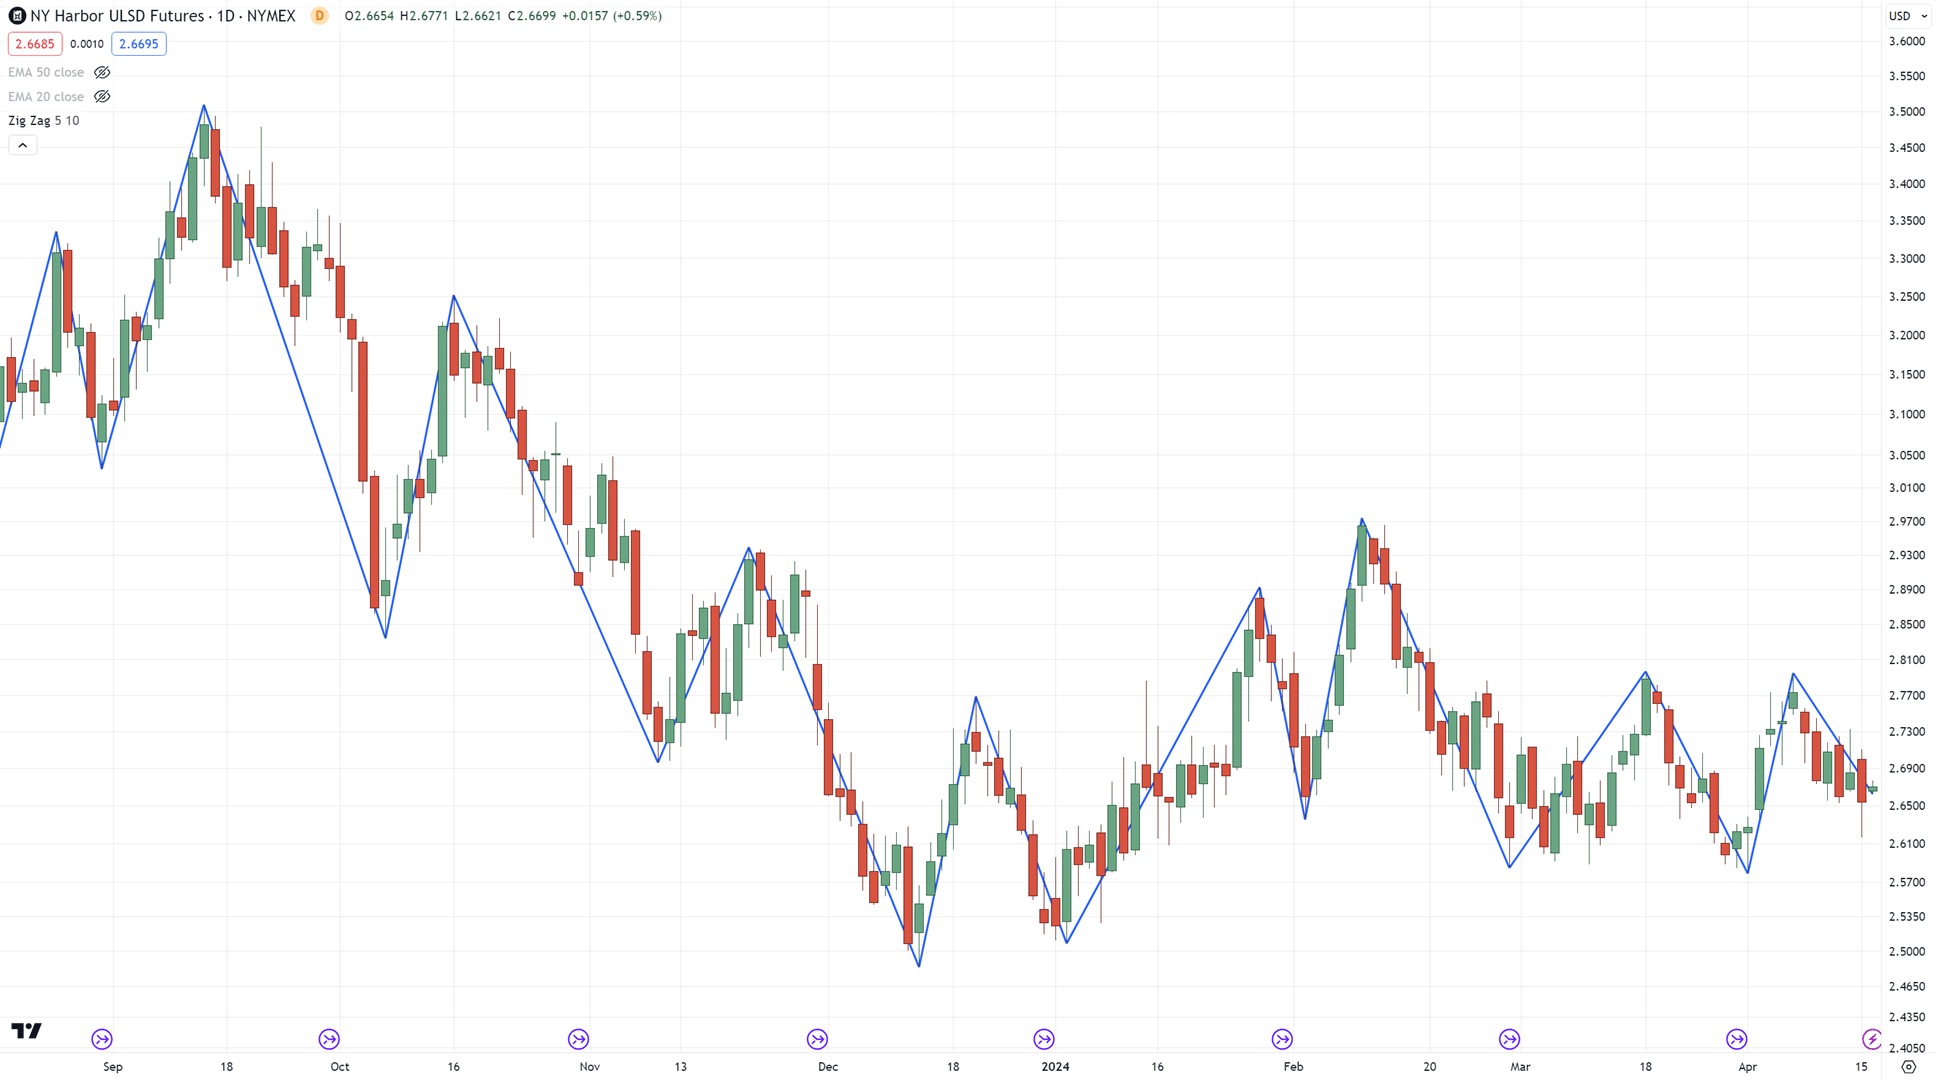
It does all the work for you automatically!
But there’s way more to this indicator than I can write about here, so I suggest checking this guide out:
The Ultimate Guide To Zig Zag Indicator
Now, speaking of indicators…
Which one do you use for divergence trading?
Let’s tackle that in the next section…
What is the best indicator for divergence trading?
The truth is that a lot of indicators can be used for divergence trading.
There is no “best” indicator out there!
Let me give you an example…
Here are three indicators placed together…
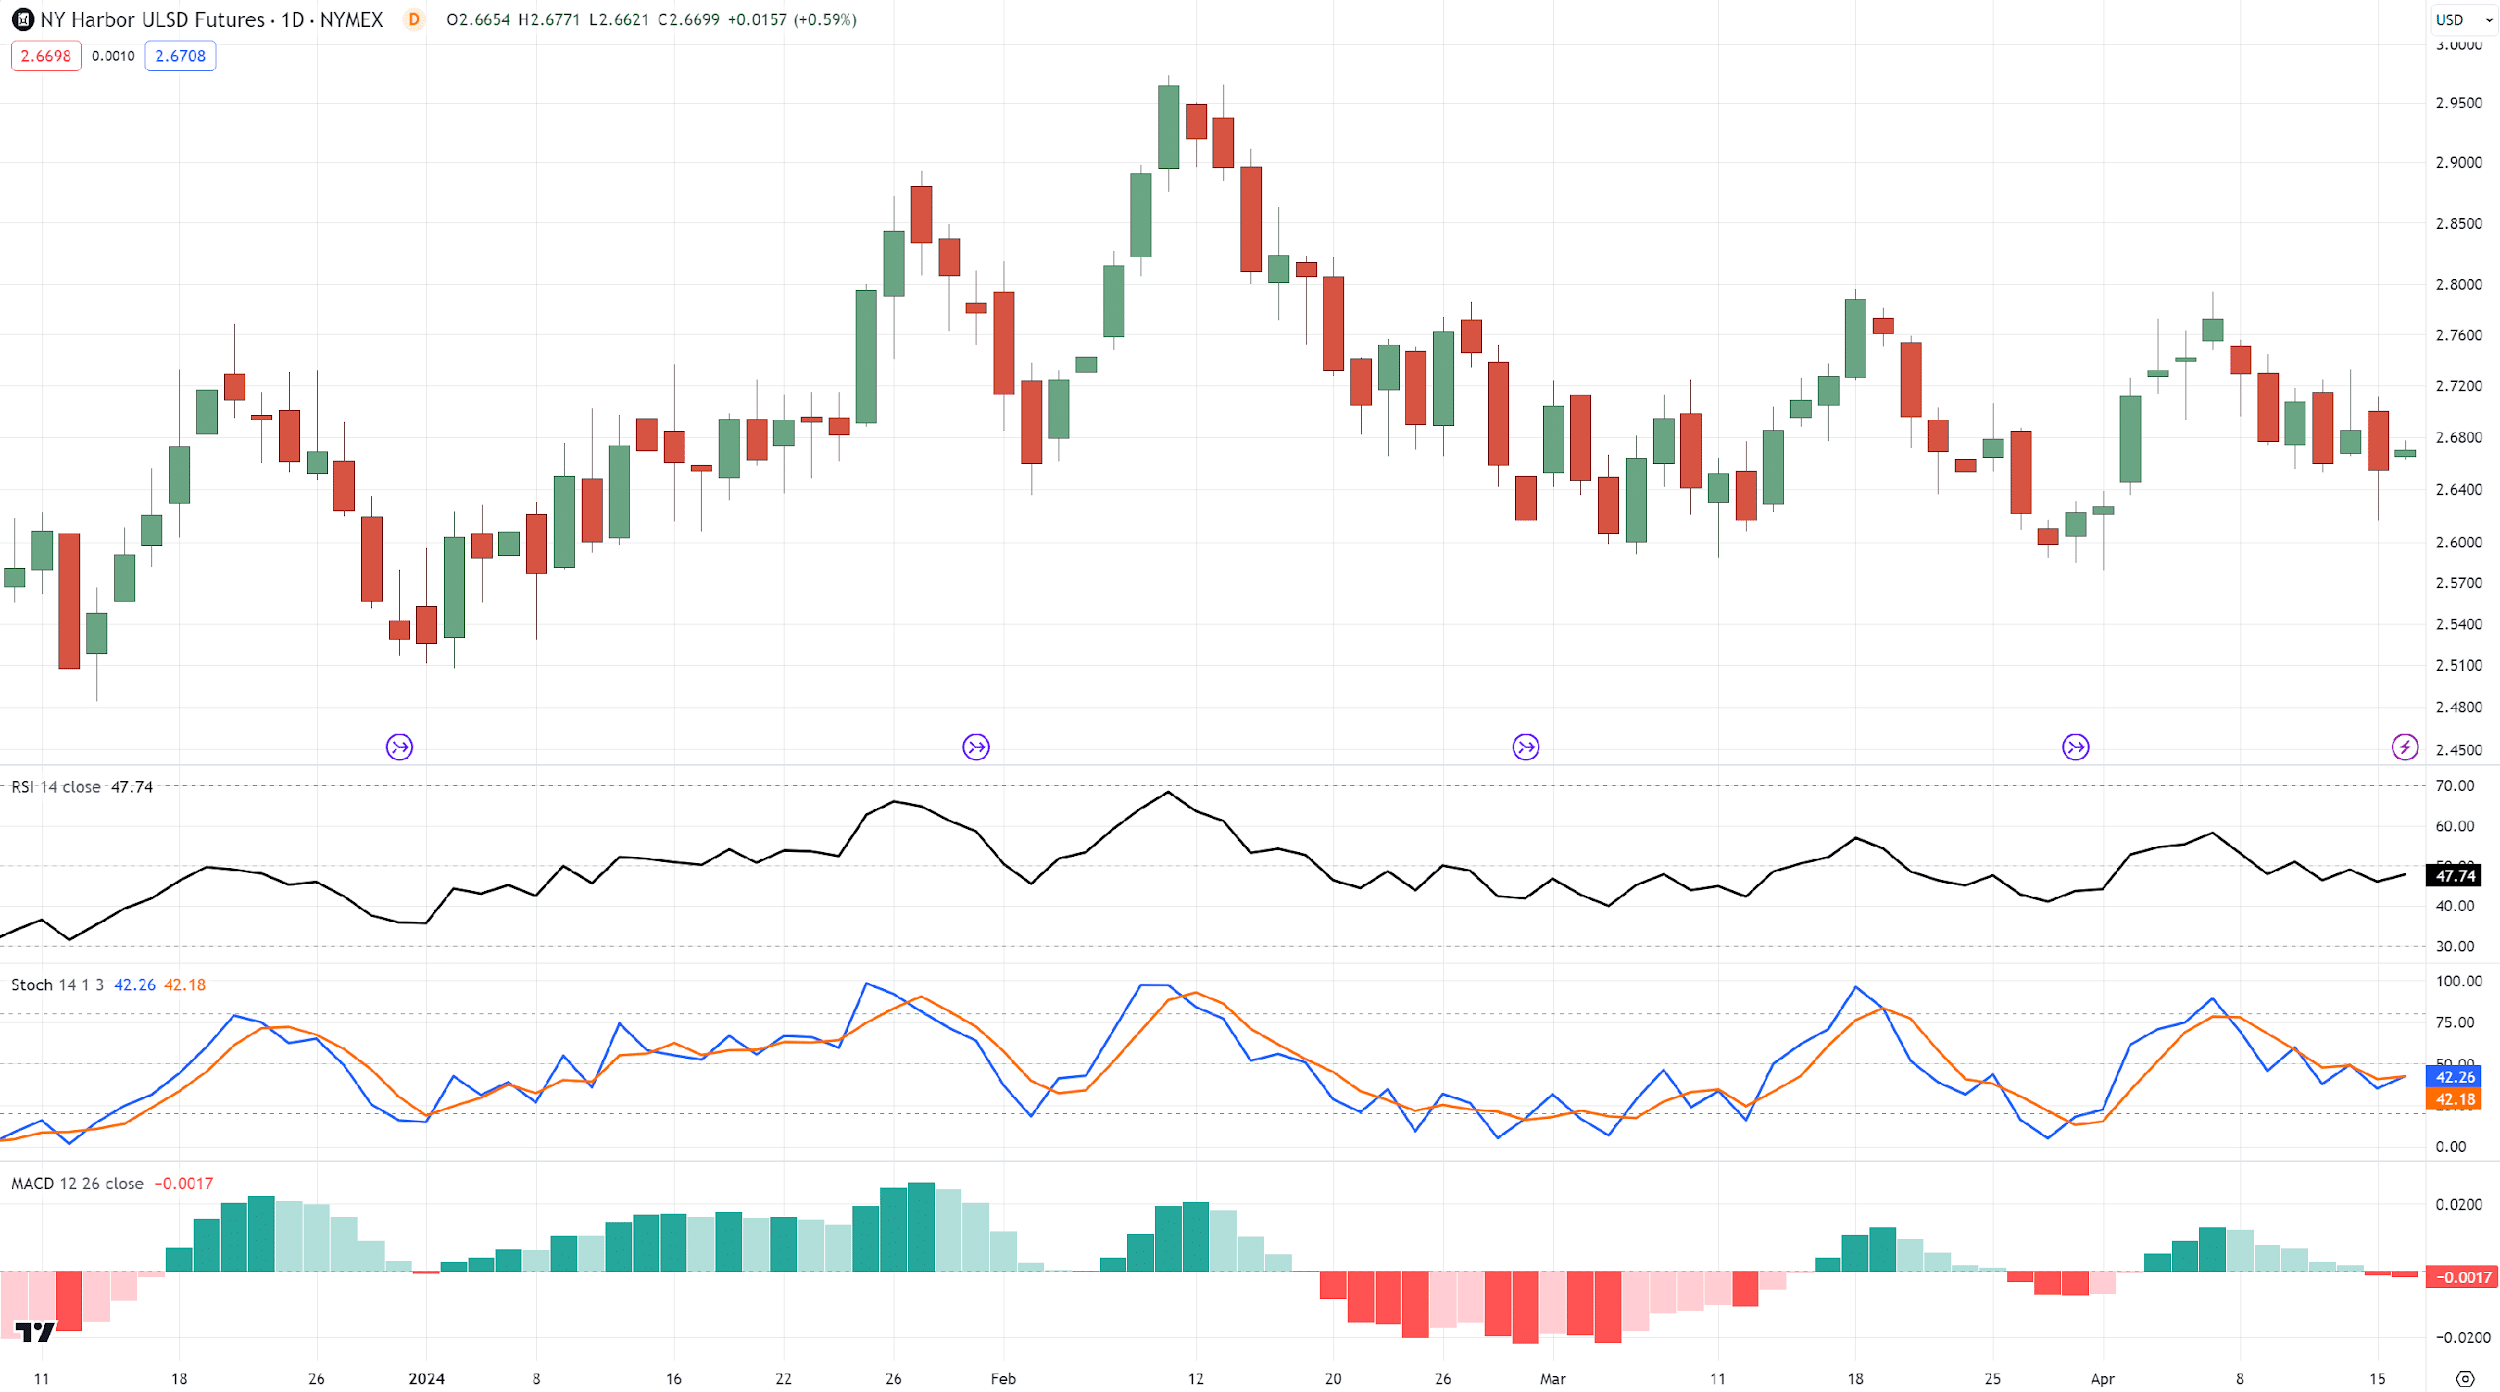
As you can see, all of them are capable of detecting divergences!
And most importantly, even at the same time…
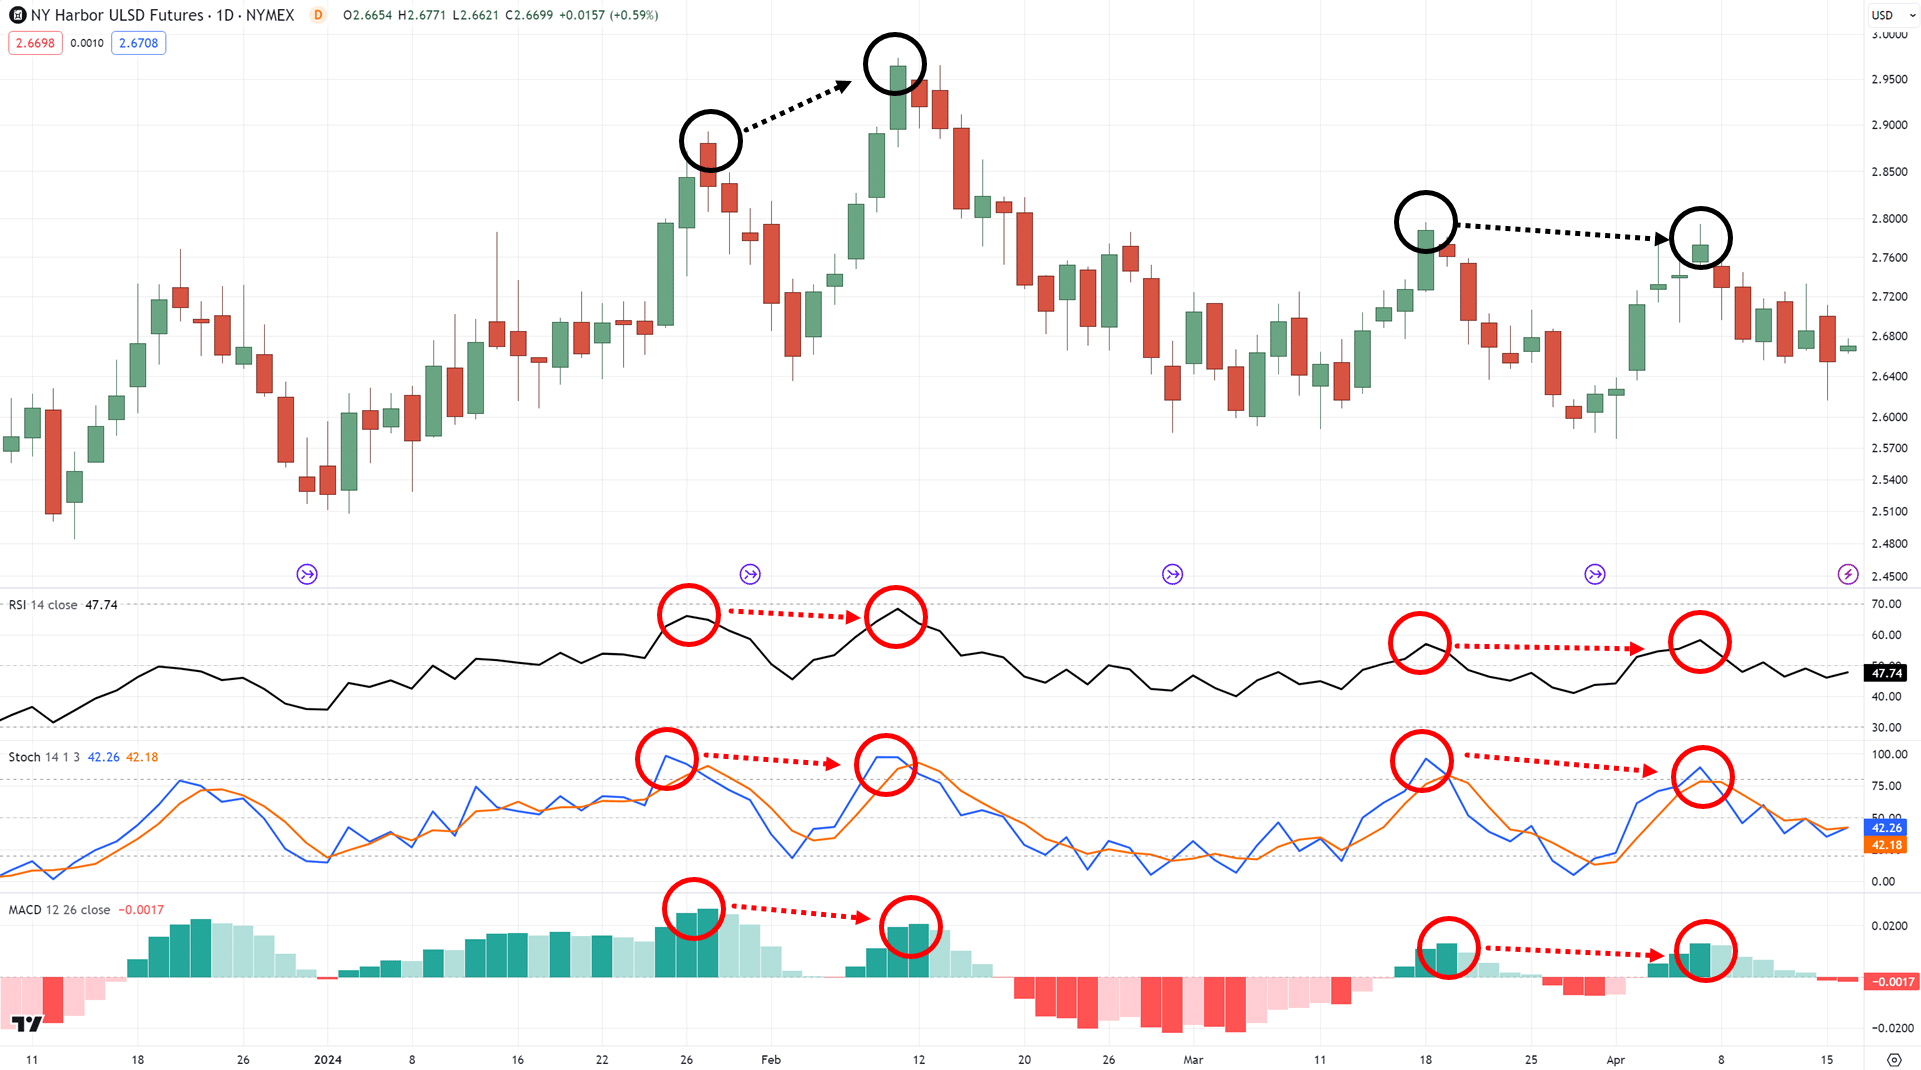
This is because they are all momentum indicators, meant to measure the momentum of the markets!
In that case… how do you know which indicator to pick for divergence trading?
The key is this:
Know the indicator to the deepest level, and choose one that makes the most sense to you.
I know it comes as a headache to you, but that’s right…
You must know an indicator down to its core details, such as its formula.
As an example, the MACD’s line is calculated by two different moving averages…

One short-term indicator to measure the short-term momentum of the market…
…and one to measure the medium-term momentum of the market.
The signal line then averages the result of the MACD line, and the difference between that signal line and the MACD line creates the histogram that you see!…

It’s like measuring the temperature data in your area for the past month, and then gaining extra temperature data from the past three months…

By looking at the temperature changes, I’m sure you can tell if things are heading into winter or summer!
Alright – so, how about the RSI indicator?
Its formula is pretty much designed to directly measure the momentum in the markets in a straightforward way:
RSI = 100 – 100 / [1 + RS]
These numbers might daunting, I know…
But it boils down to this:
Average Gain / Average Loss
Simply put, if there are more days when that specific market is doing well than when that market is doing badly…
The RSI value increases!
This is similar to counting calories when trying to lose weight…

If you lose more calories than you gain, you lose weight!
Finally, take a look at the stochastic indicator.
It’s measured in this manner:
%K = (Current Close – Lowest Low) / (Highest High – Lowest Low) * 100
%D = 3-day SMA of %K
Where:
Lowest Low = lowest low for the look-back period
Highest High = highest high for the look-back period
%K is multiplied by 100 to move the decimal point to two places
To visualize it, imagine you’re at a playground watching a child on a swing…

The child swings higher and lower depending on how much momentum they have.
The stochastic indicator is like measuring how high the child swings relative to the highest point they’ve reached!
The %K value tells you how high they are right now, while the %D value is the average height of their swings over the past few minutes.
This helps you see if the child’s momentum is increasing or decreasing, just like the stochastic indicator helps you gauge the momentum of a stock’s price movement.
Make sense?
So, at this point…
I’m sure you can tell me that all these indicators have one end goal…
…and that is to measure momentum in the markets in different ways, right?
However – all that matters is which ones make the most sense to you.
Importantly, you should never blindly use an indicator just because someone else is using it…
…a winning trader must understand it at a deeper level.
Now…
How does this all fall into place?
How can you do divergence trading?
Enter, manage, and exit your trades?
Most guides only tell you what divergence trading is, but don’t teach you how to trade them.
So let’s use everything that you’ve learned so far to trade the markets with divergences!
Divergence trading strategy: How do use it to enter, manage, and exit your trades
Repeat after me:
Divergence trading is only one part of a trading plan.
That’s right!
Spotting bullish and bearish divergences is only one small part of a bigger trading plan.
This is why I developed a straightforward approach when looking at your charts.
And that is:
The M.A.E.E formula
This formula simply means you…
- Identify the Market structure first (downtrend, uptrend, range?)
- Identify the Area of value on the chart (where’s your support and resistance?)
- Find where your Entry is (bullish or bearish divergence setup)
- Identify your Exit (trailing stop loss or before the nearest market structure)
And now…
I will demonstrate to you how this works!
Identify the Market Structure
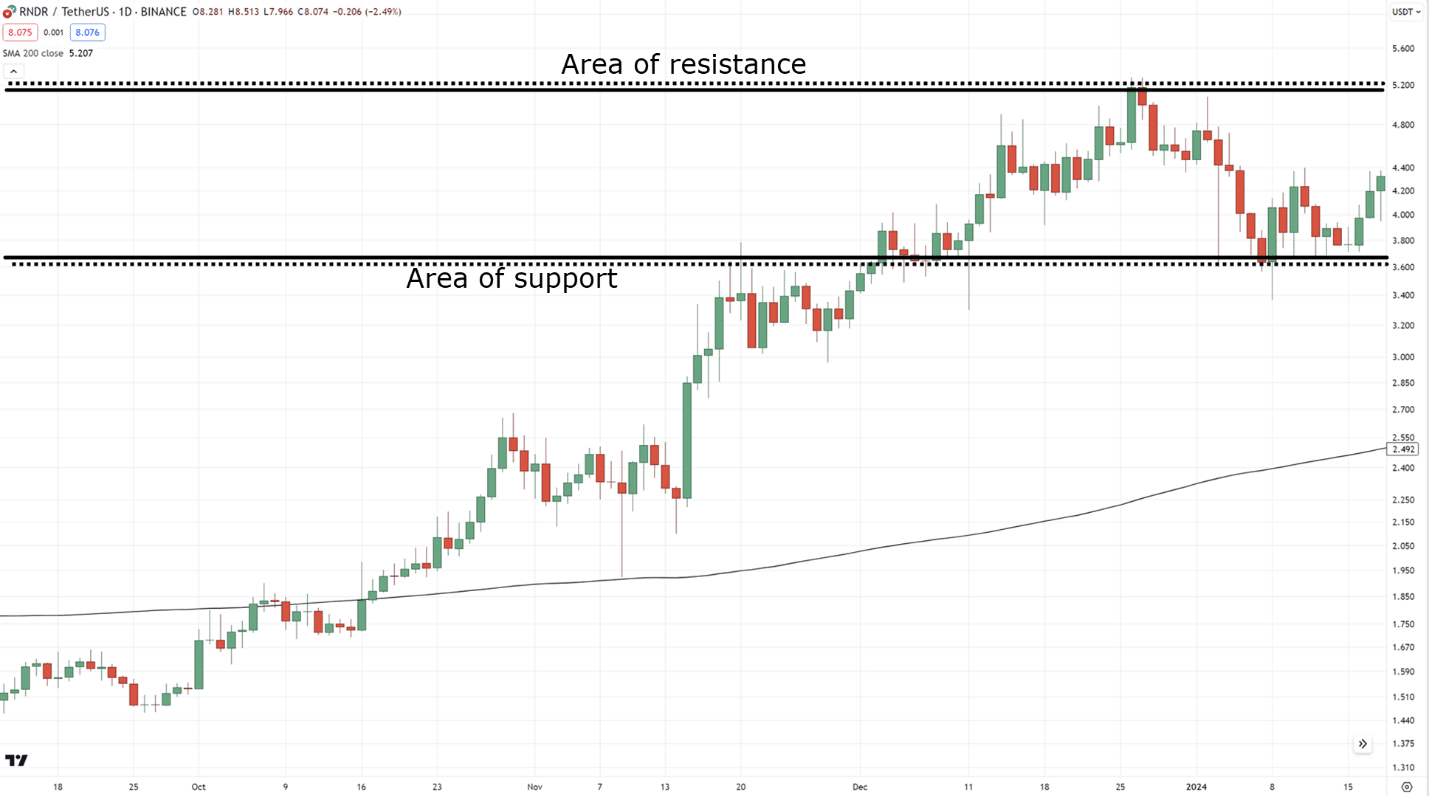
The example that we will use today is RNDR on the daily timeframe…
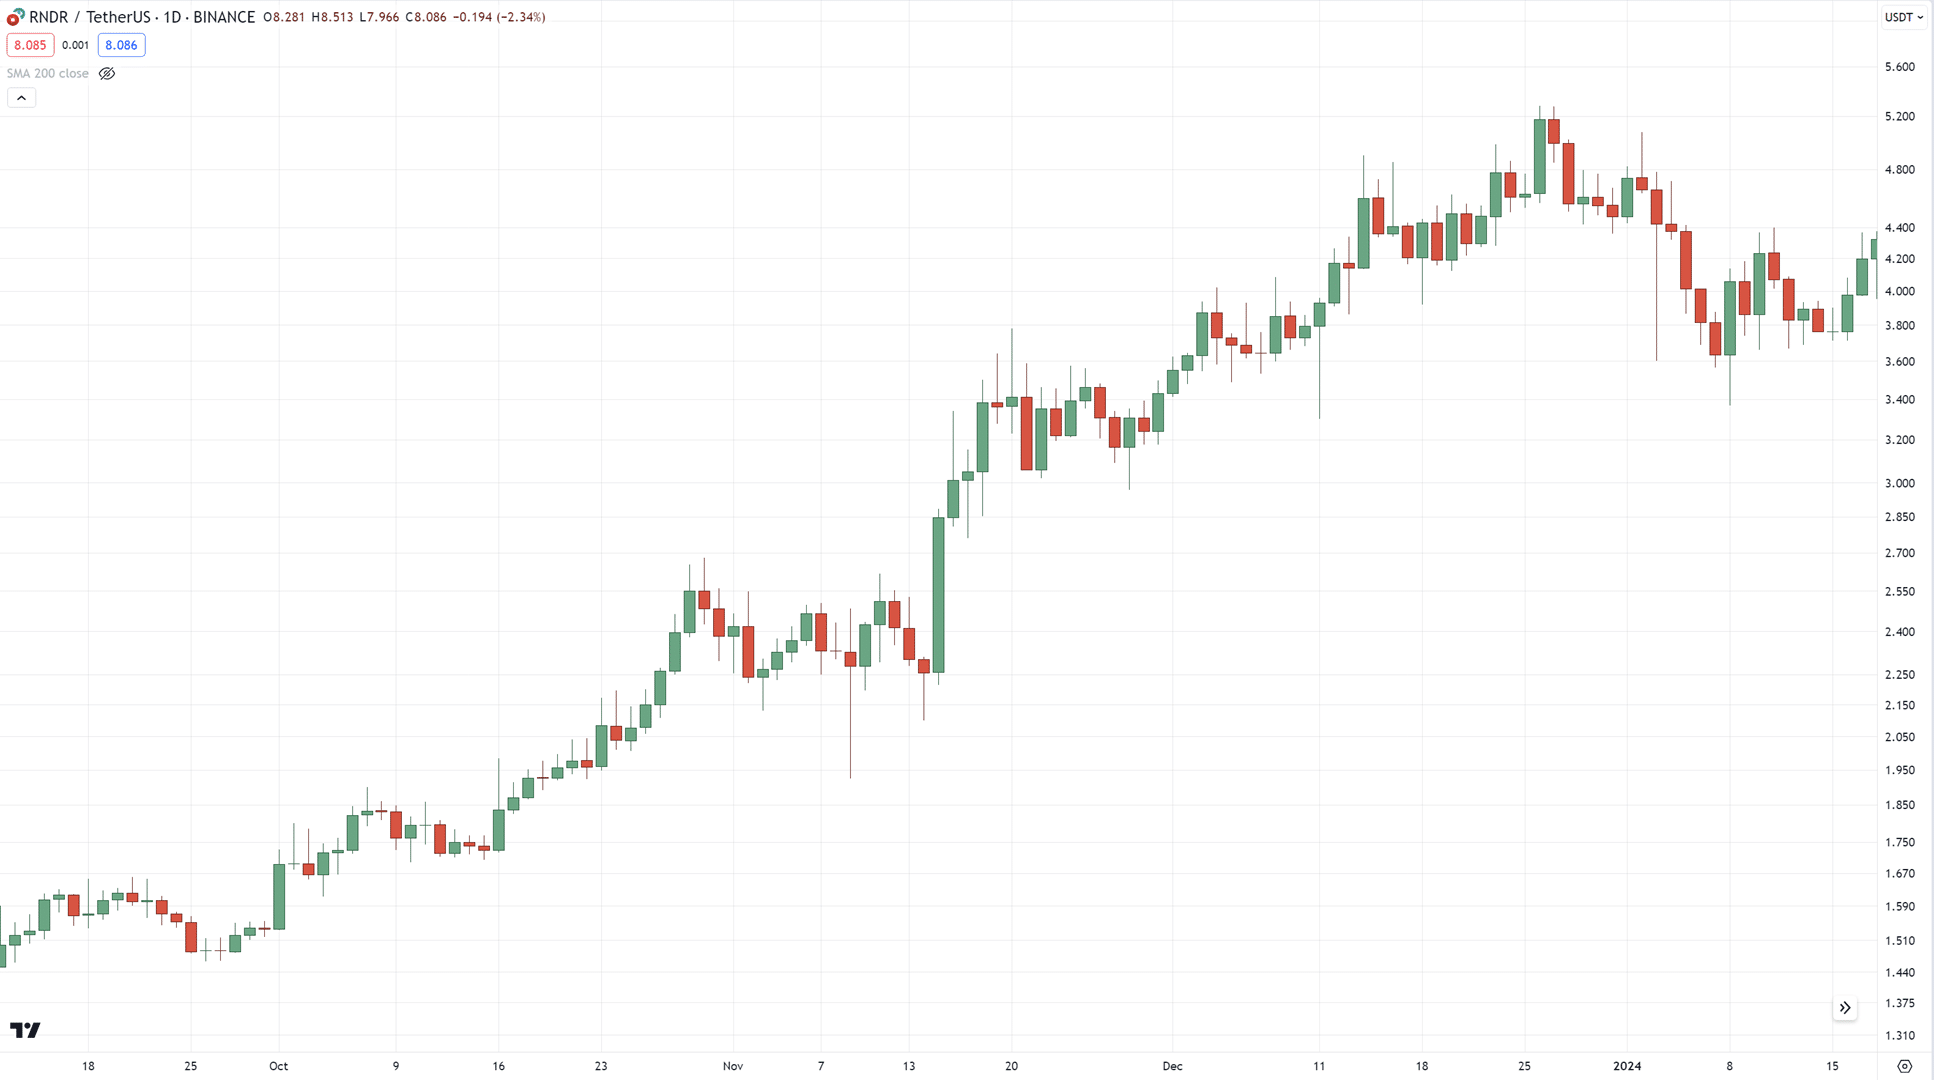
Now you want to ask yourself:
Is this in an uptrend?
Downtrend?
Or in a range?
Well, it’s in an uptrend.
But you want to develop a rule that consistently defines whether a market is in an uptrend or downtrend!
One such tool that can help you is the 200-period moving average…
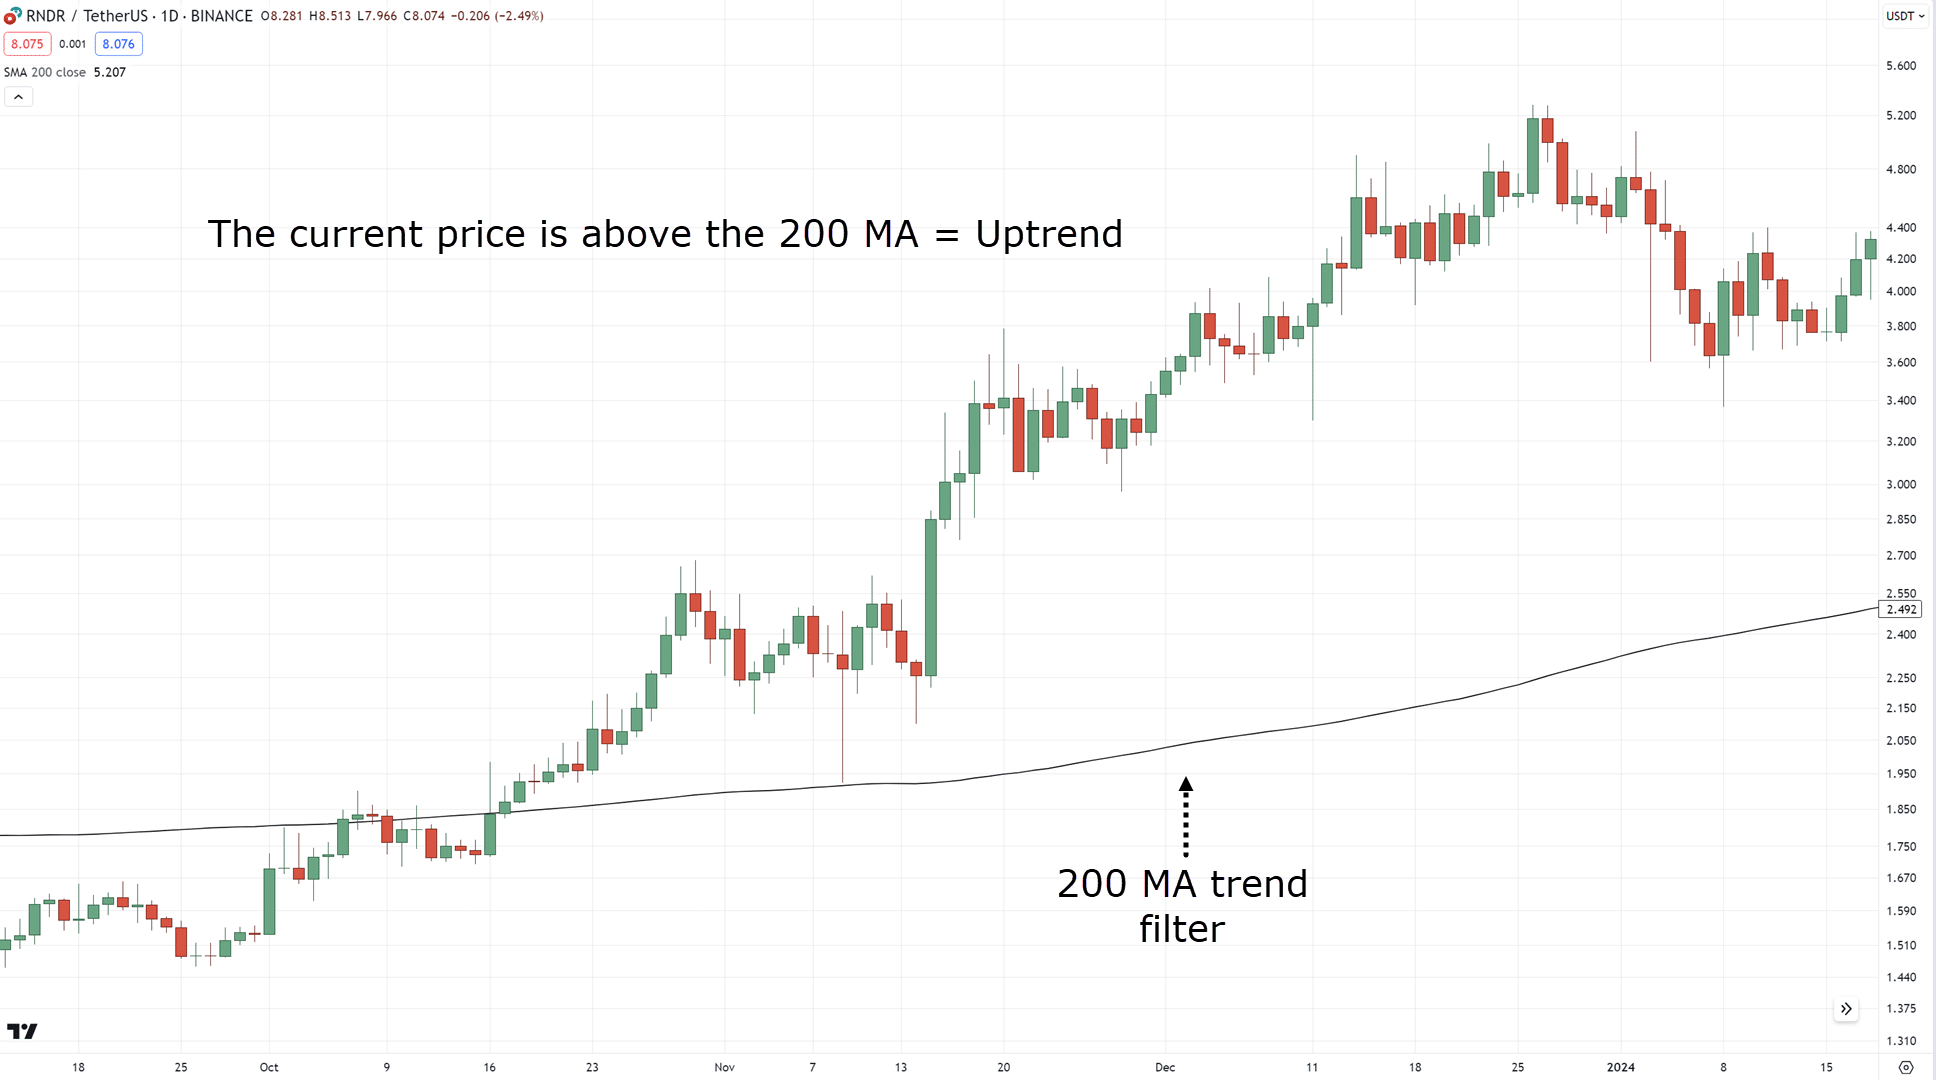
If the price is below the 200 MA = Downtrend
If the price is above the 200 MA = Uptrend
This part is always the most important.
Why?
Because once you define that the market is in an uptrend, you want to ensure you find the “relevant” setup in such market conditions!
This means that in an uptrend, we only look for bullish divergence.
Make sense?
Identify the Area of value
When it comes to the area of value, what comes to mind?
Support & resistance!…
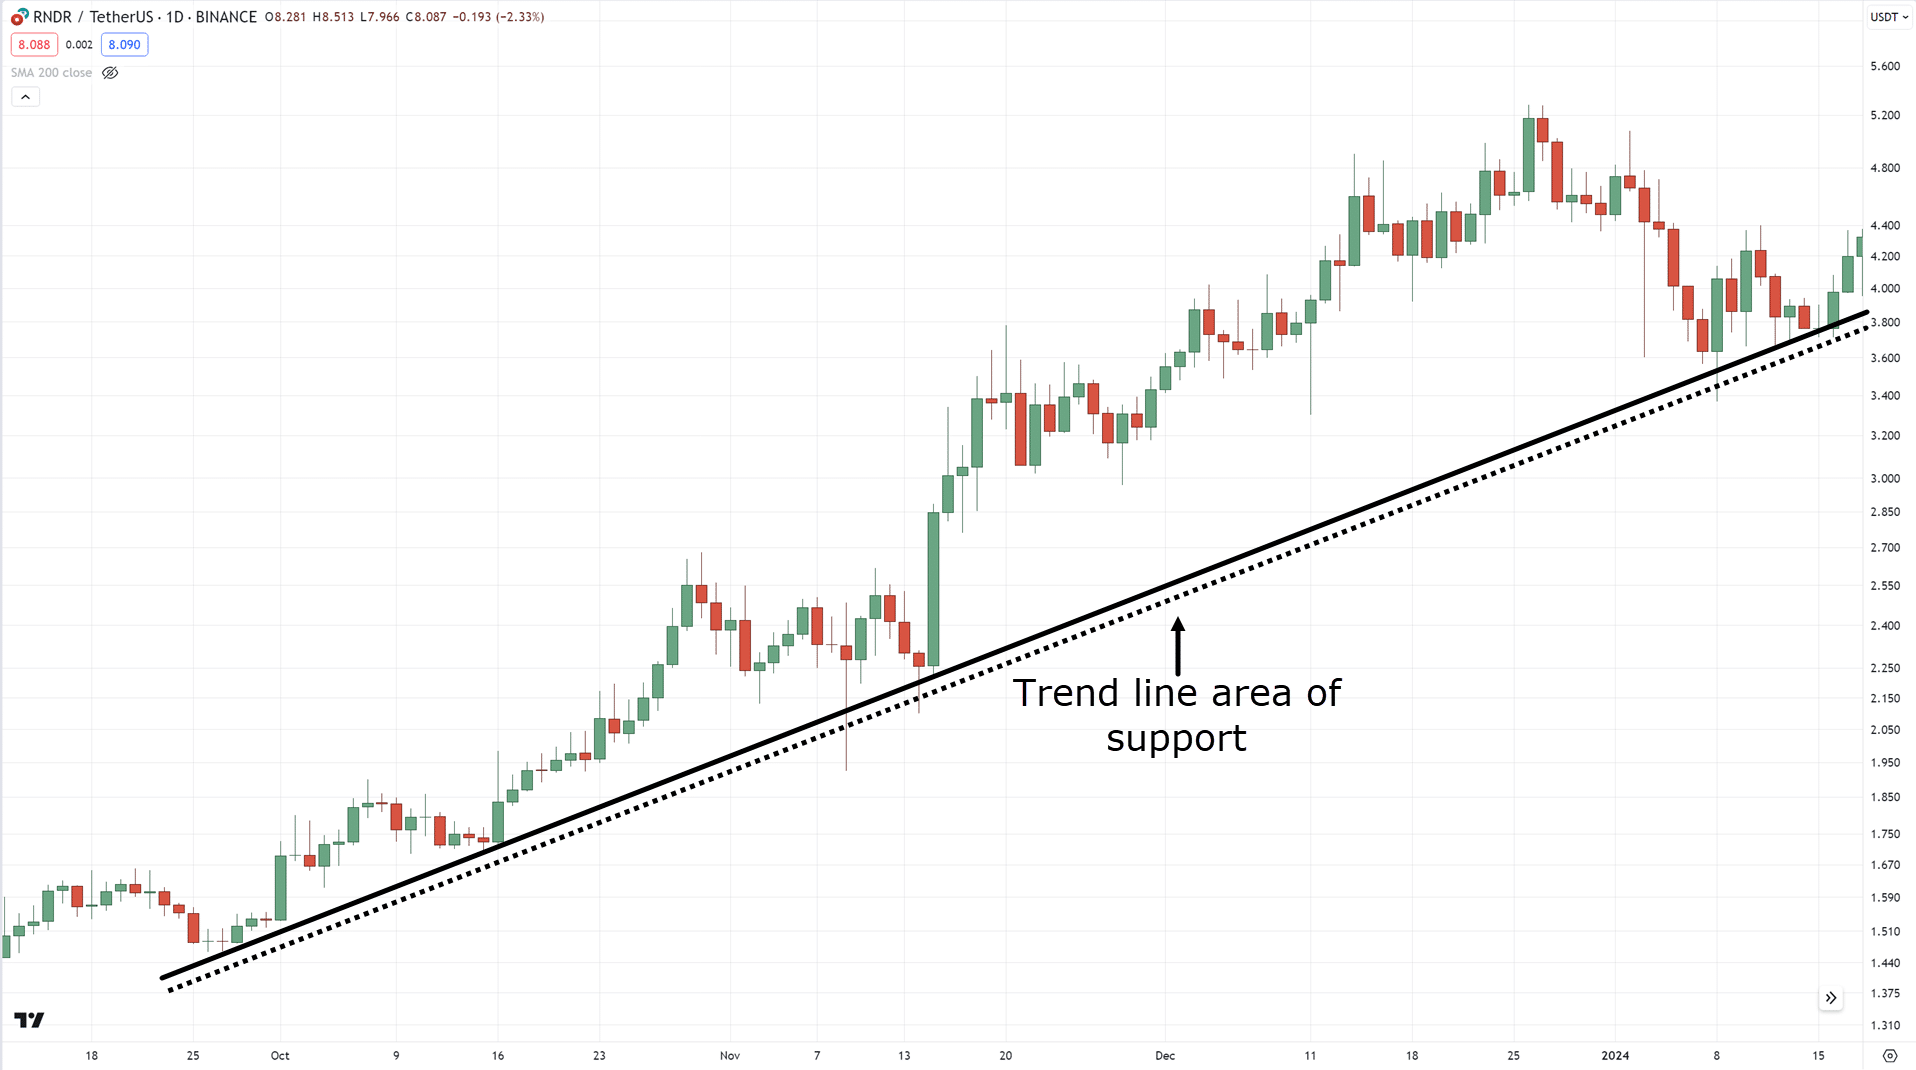
However, always make sure to keep in mind that trend lines also have an edge in the market and are a great tool for finding areas of value in trending markets…
So, now that we’ve defined our uptrend and area of value, next is our entries.
Identify your Entry
As a recap, here’s the cheat sheet for divergence trading…
You probably already have it saved on your computer, but how and when exactly do you enter?
For this example, we’ll use the 14-period RSI.
So, once you spot a bullish divergence…
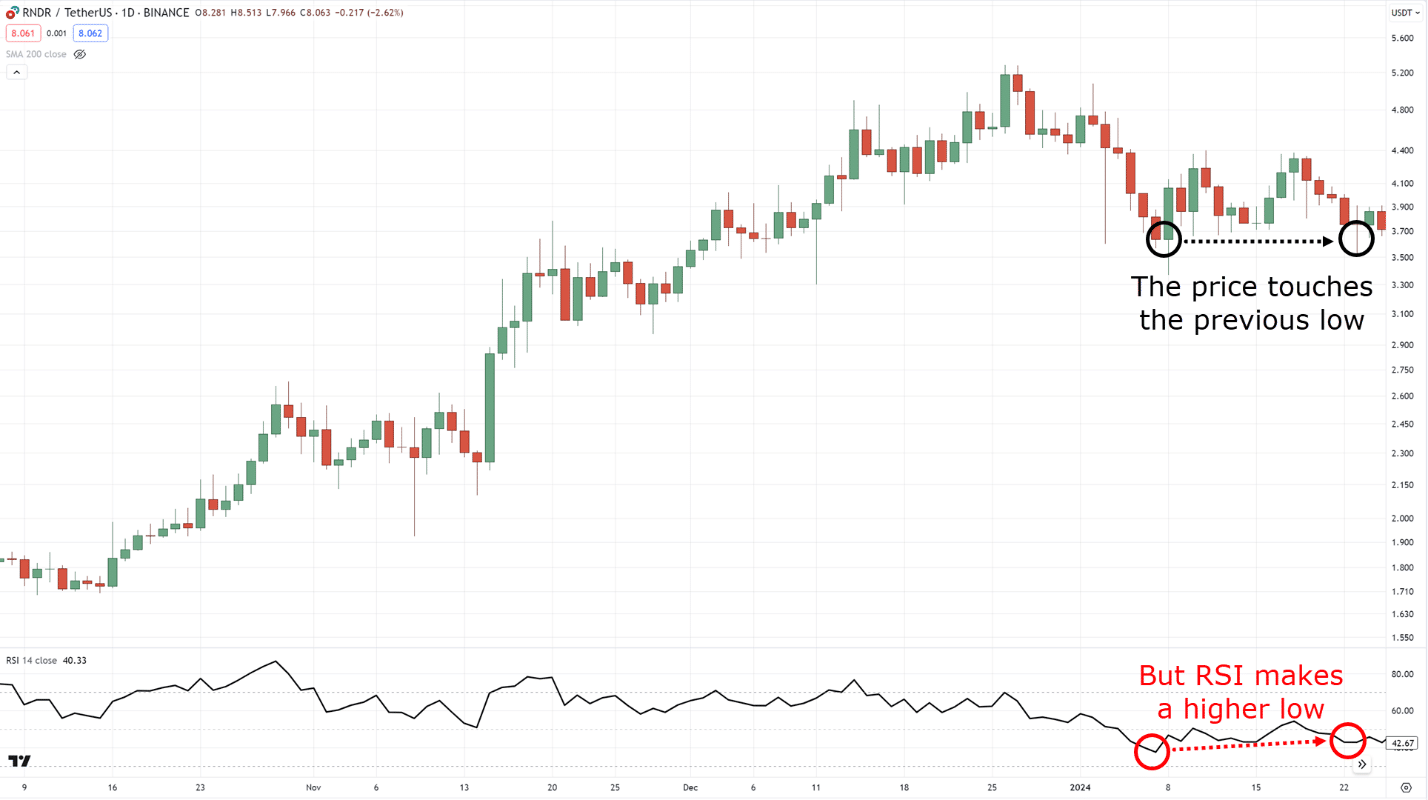
Then you want to wait for the price to close above RSI 50…
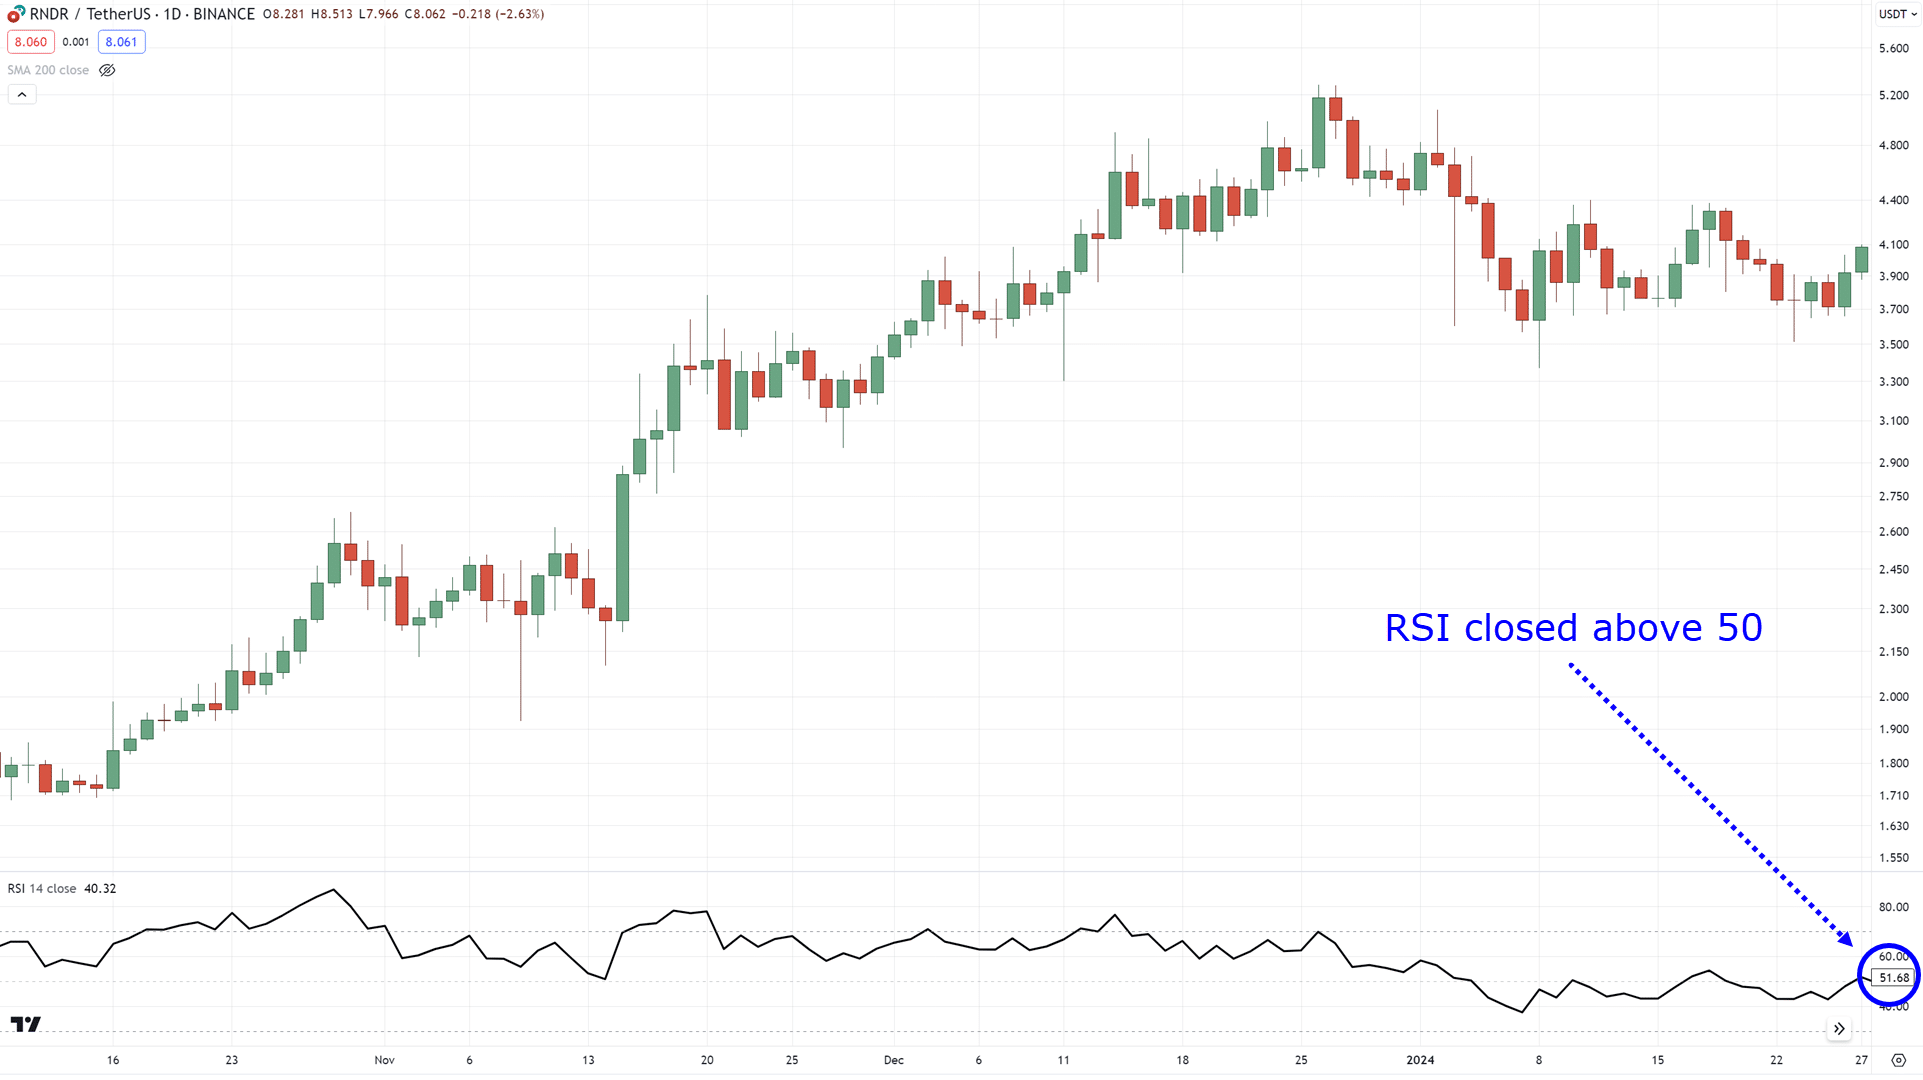
Then you enter the trade on the next candle!…
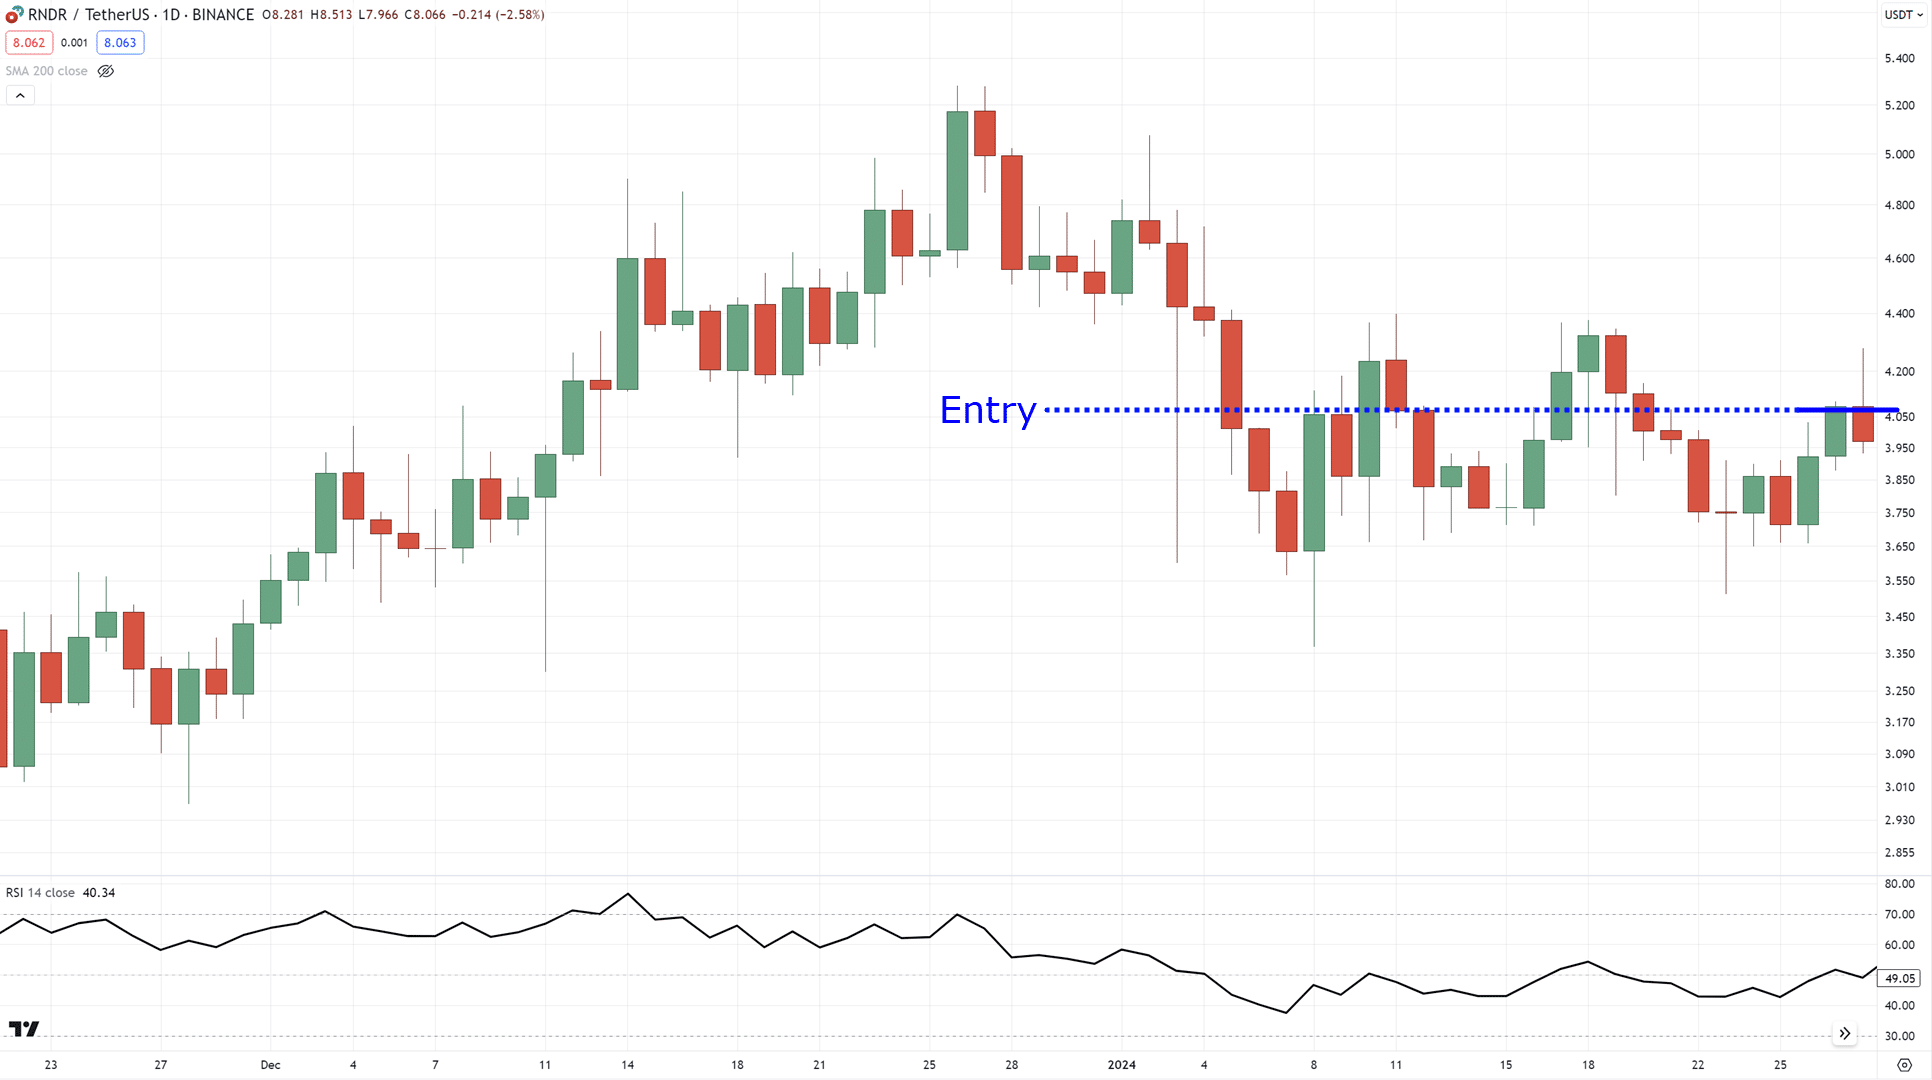
By the way…
If the bullish divergence happens when the price is below RSI 30, then you can wait for the price to close above RSI 30 instead.
In our example, the divergence happened when the RSI was above 30, so we waited for the price to close above RSI 50.
All clear?
Identify your Exits
This can be worked with a couple of caveats to think about…
Where’s your exit in case you’re right, and where’s your exit in case you are wrong?
What about your stop loss and take profits?
Now, if the price closes above RSI 30 and makes a valid bullish divergence trading setup, you want to subtract 1 ATR below the lows…
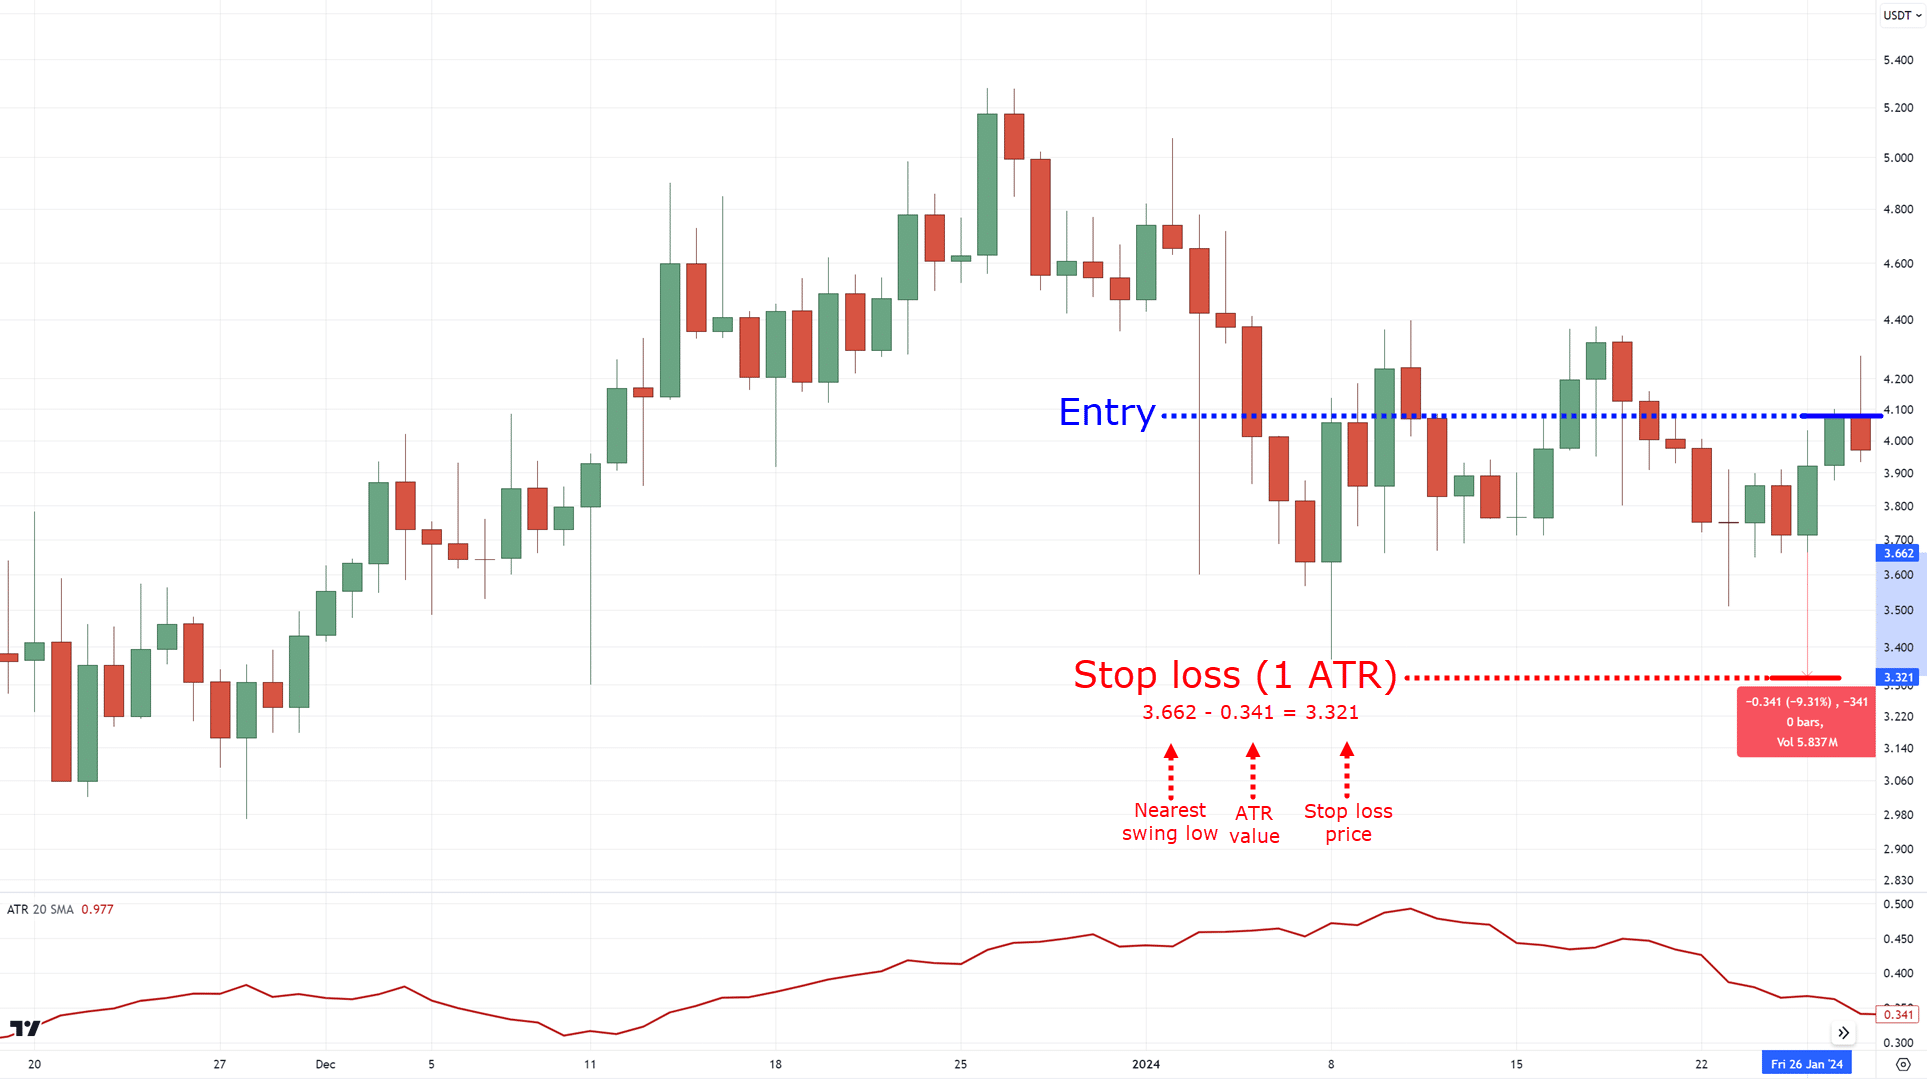
If you’re a regular reader, then you’ve probably heard about the ATR a lot of times.
But that’s because this indicator is so versatile, and gives you an objective way to set your stop loss!
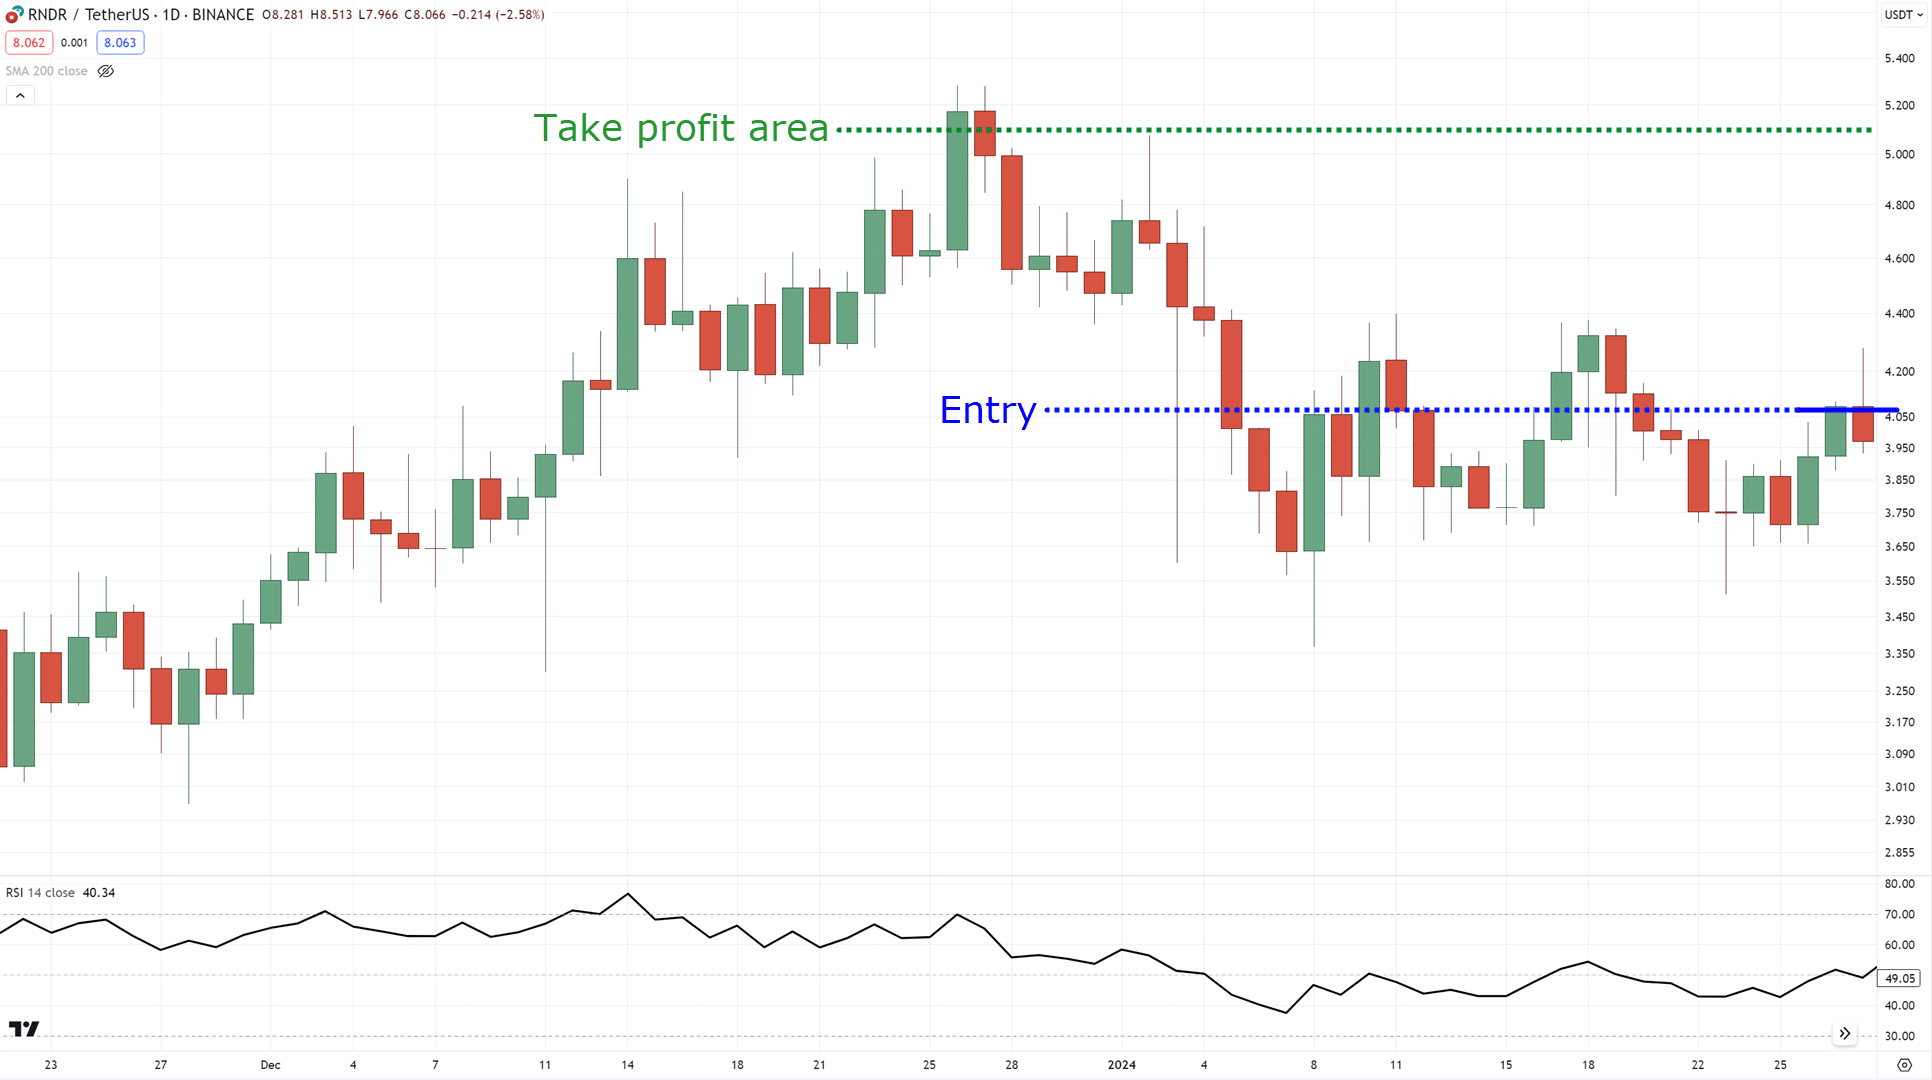
Now, how about taking profits?
You can consider taking profit before the nearest high…
Or you can consider partially taking profit at the nearest high and trail your stop loss using a medium-term moving average such as the 50 MA!…
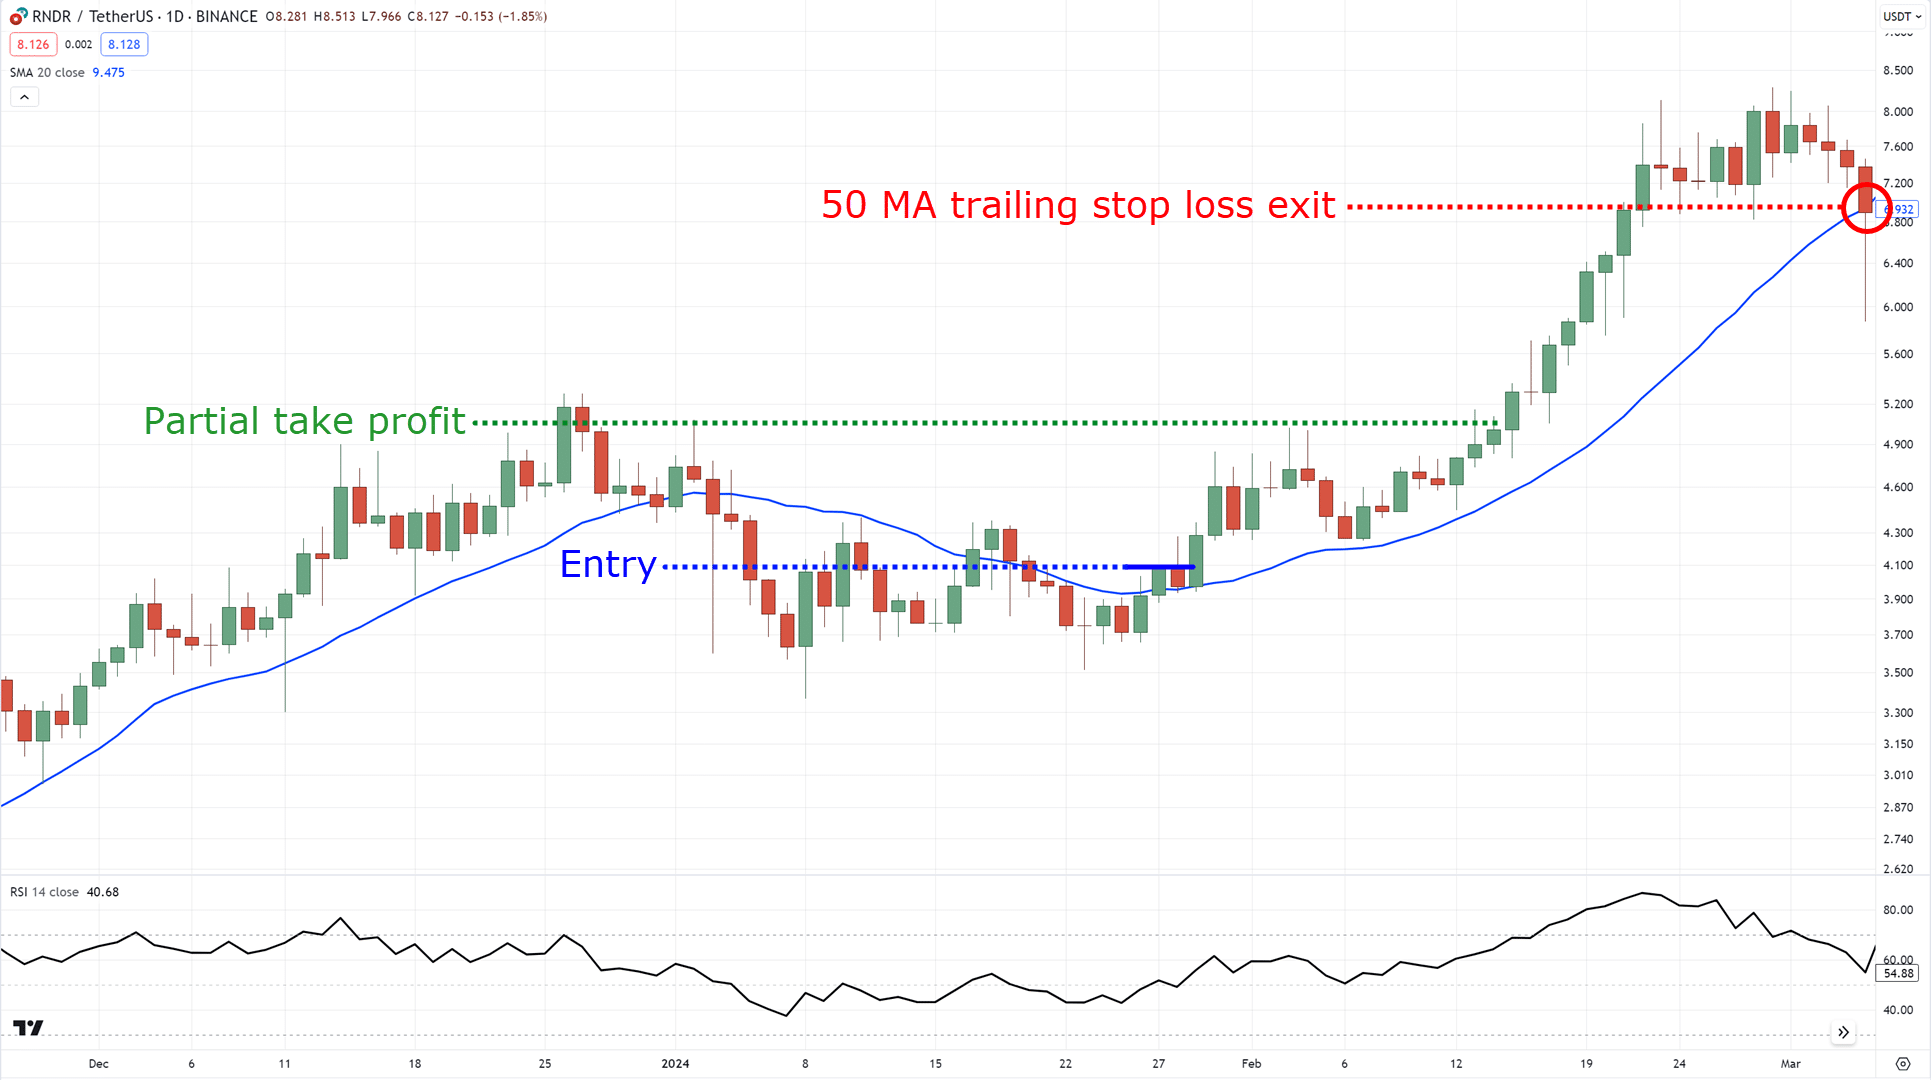
Of course, this is just a cherry-picked example, but it makes sense, right?
Now here’s the thing…
This setup is pretty conditional.
Meaning, it can take a while to spot a setup where bullish or bearish divergences form at an area of value.
To remedy this, you have two options:
- Trade the lower timeframes, such as M30 – H1
- Or trade the higher timeframes but focus on multiple markets and have more open trades
Got it?
Finally, before I end this guide…
I want to share with you some extra notes on what not to do with divergence trading.
This is crucial, as it’s important to know how to do it the right way and how to do it the wrong way!
What not to do when using a divergence trading strategy
There’s no doubt about it…
There are a lot of things that you must keep in mind as a trader.
However, here are the most important things on what not to do with divergence trading…
Being inconsistent with your timeframe
I mentioned that you can choose to do divergence trading on the lower timeframe or higher timeframe.
This is why I have to emphasize to you right now to choose a timeframe that you know you can stick to.
Once you have it, practice spotting divergences in trading on that consistent timeframe.
The last thing you want to do is try to spot divergences on all timeframes… it gets messy fast!
Remember, when you’re inconsistent in your trading, you get inconsistent results.
Blindly following the divergence trading cheat sheet
Here’s the truth:
No matter what the usual textbook (or even this guide) shows you…
There will always be slight variations, and there can be exceptions.
So when in doubt, stay out!
Finally…
Not practicing enough to identify swing highs and lows
The effectiveness of divergence trading mainly depends on how well you can spot them.
This is why you must constantly practice plotting your swing highs and lows with or without the zigzag indicator that I shared with you!
And again, we have a whole training guide dedicated to it, which you can check out here:
How to Read Price Action (For Dummies)
Sound good?
With that said, let’s have a quick recap of what you’ve learned today!
Conclusion
There’s no way around it…
Divergence trading can take some time and practice to get used to.
That’s why I designed this guide in a way to shortcut that learning curve, help you avoid noise, and direct you to concepts that need your focus on your way to divergence trading.
Nonetheless, here’s what you’ve learned today:
- A divergence happens when the price appears to make significant gains but the indicator detects that the momentum to reach such gains is slowing down (and vice versa for bearish)
- Learning how to spot swing highs and lows effectively is the key to identifying and spotting divergences
- Different indicators can be used for divergence trading such as MACD, Stochastic, and RSI, but what’s crucial is for you to choose an indicator that makes the most sense to you
- Using the MAEE formula creates a complete trading strategy for divergence trading
- Always make sure to be open for slight variations of divergences in the cheatsheet, real-time trading will always be different
There you go!
A complete masterclass to divergence trading!
Now…
As you apply this method, always feel free to return to this guide.
Nonetheless, here’s what I’d like to know:
When have you first heard of divergence trading?
Do you plan on trying it out after reading this guide?
If you’re already using divergence trading, what tips would you recommend?
Let me know in the comments below!
Register at Binance