Precision Trading: Introducing Our MT5 Indicators for Optimal Market Insights
We have set a premium price for our MT5 indicators, reflecting over two years of development, rigorous backtesting, and diligent bug fixing to ensure optimal functionality. Our confidence in the precision and accuracy of our indicators is such that we regularly showcase them in real-time market conditions through daily content on our social media channels.
Our belief in trading simplicity, adhering to the principle of buying low and selling high (or vice versa), is echoed in our indicators’ clear display of potential entry and exit points. We consistently provide daily content demonstrating our indicators in action. Additionally, we offer traders the opportunity to rent our indicators for $66 per month. This allows traders to test the indicator for one month with their chosen trading pair before committing to a yearly subscription.
We are committed to monitoring user feedback closely and making necessary improvements to our indicators should any bugs arise, ensuring that traders have access to the most effective tools for their trading endeavours.
Volume Clarity Pro – CLICK HERE TO BUY
Compatibility: Volume Clarity Pro works with all financial instruments currency pairs, indicies, equities, commodities and cryptocurrencies
The Volume Clarity Pro maps out where price is consolidating, retracing, resisting or settled in areas of support. The Volume Clarity Pro accurately displays the month’s price action, offering crucial data about your selected trading pair for chart analysis and trade initiation.
The Volume Clarity Pro is a powerful indicator that displays the distribution of trading volume across different price levels. A horizontal histogram, visually illustrates where the most significant trading activity has occurred during a specific time period. Traders use the Volume Profile to identify key support and resistance levels, assess market sentiment, and pinpoint areas of liquidity.
The Volume Clarity Pro signals an increase in volume by elongating the bars on the horizontal histogram and shading the volume bars according to the concentration of trading activity and liquidity. To gain a comprehensive understanding of the indicator’s capabilities and learn how the Volume Clarity Pro works, Please refer to our attached YouTube video for valuable insights into the functionality and detailed breakdown of how the Volume Clarity Pro presents essential information, assisting traders view charts with clarity.
Key Features
- Offers an intuitive interface for easy interpretation and analysis of volume data.
- Provides insights into trading activity by presenting volume data in a horizontal histogram.
- Extended bars on the horizontal histogram signify the presence of liquidity at the corresponding price level.
- Darker shade on the horizontal histogram indicate the concentration of trading activity.
- Shows volume distribution across different price levels to identify areas of high or low trading activity.
- Detects volume patterns such as spikes, divergences, or trends to assist in making trading decisions.
- Review the volume data for your selected trading pair over the past five days, week or month.
- Can be used in conjunction with other technical indicators for comprehensive market analysis.
- Provides real-time updates of volume data as new trading activity occurs.
- Allows users to analyze historical volume data to identify past trading patterns and trends for chart anlysis.
- Facilitates the examination of volume data across various timeframes for analyzing longer-term trends.
- Allows users to customize settings such as the colour of the horizontal histogram, period length and the number of periods.
*The attached GIF file showcases a 2.5-hour video of the Volume Clarity Pro in action, condensed into a few seconds.
Volume Clarity Pro Settings
Interval count: Specify the number of periods you wish to view, which depends on the selected interval period. Example: 1 day, 2 days, 3 days, 1 week, 2 week, etc.
Interval period: You have the option to choose from intervals ranging from one minute to one month.
Other settings: You can keep the remaining settings as default, they will not affect the indicator’s performance.
Chart Analysis: Perform chart analysis using a 1 week interval period and 1 interval count to identify the support and resistance levels for the current week, indicating where the price is consolidating or encountering resistance.
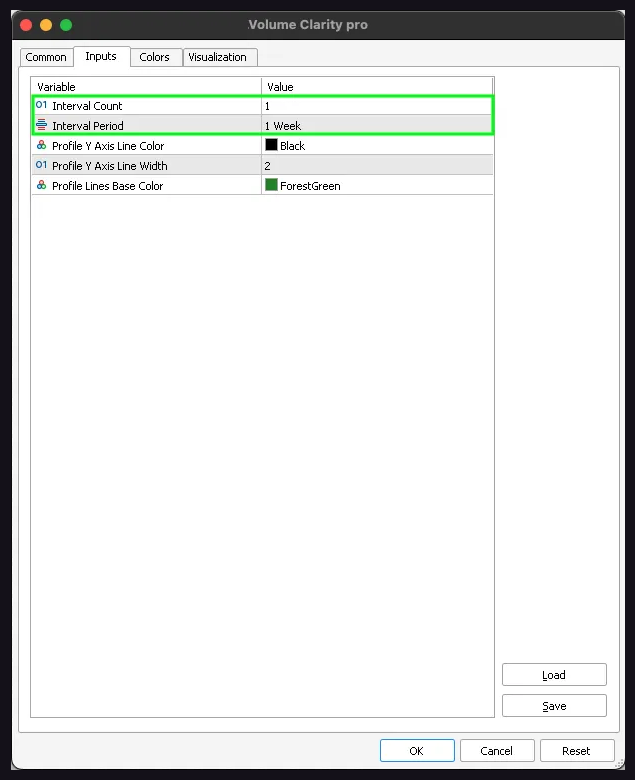
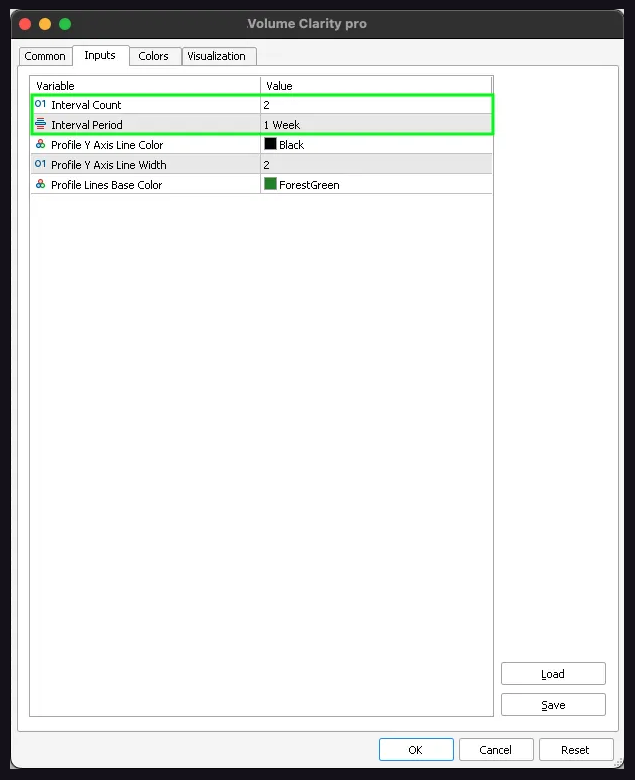
Chart Analysis: You can also use a 1 week interval period and 2 interval count to view the support and resistance levels for the previous week compared to the current week.
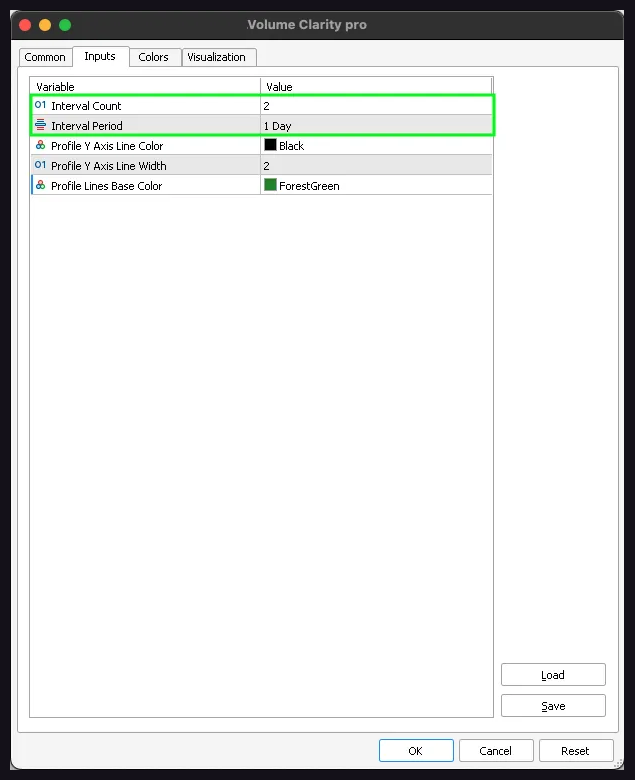
Day Trading Settings: Adjust the interval period to 1 day and the interval count to 2 to compare the current price levels with the previous day’s support and resistance. Volume Clarity Pro highlights areas of liquidity when the horizontal histogram darkens or when there are spikes in the histogram extend. (see GIF in description)
Register at Binance