Parabolic Stop and Reverse is a technical analysis tool that a lot of active traders may find useful. It is favored by futures traders that want to always have a position open.
PSAR, parabolic stop and reverse, is one of the more complex indicators. It was originally intended for use in the futures market but like most good trading tools is applicable to any form of trading with a chart of prices. The original use was for hedging positions. Some futures trading, those whose job it is to buy and sell physical commodities not just speculators, requires a position to be open all the time to hedge against future price fluctuations. In case of these professionals, when a bullish position is closed a bearish position must be opened and vice versa. The problem of knowing when to open and close those positions can be solved, at least in theory, with the help of PSAR.
The indicator was developed by J. Welles Wilder jr. and takes price action as well as time decay into account within the equation. It displays as a dot above or beneath each periods price action and is used as support/resistance targets and for entry and exit signals.
A futures trader would follow its signals like this: when the dots are below the candlesticks long positions are opened. When prices move below a dot the trend is reversed and traders consider opening short positions. Each time the dot switches sides a new position is opened. An options, forex or CFD trader could open a position with each change although this is not always the best approach. Many times large portions of the move have already occurred, especially if you are using a short term time frame, so waiting for pull backs/relief rallies and tests of support/resistance is usually a good idea. Targets for this support/resistance is the PSAR.
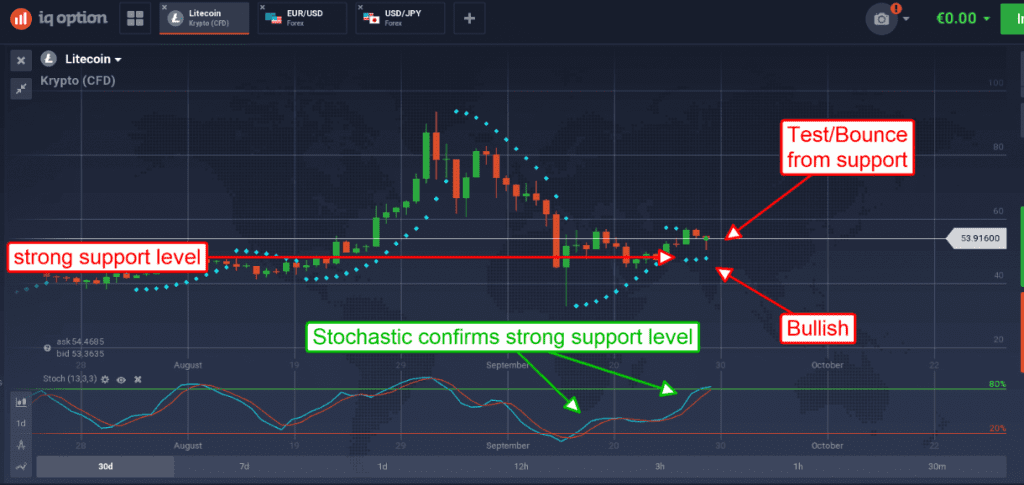
The indicator, like all others, is a cold and heartless one giving both bull and bear signals in either kind of market. This is why some form of additional analysis is needed to weed out false and less probable trading signals. In this instance a multiple time frame approach with PSAR could work, some traders also prefer to add stochastic to the mix. In this instance we will use the daily chart and PSAR to set the trading direction for today and then move down to an hourly or 30 minute chart and stochastic for entry signals. In the chart above you can see that Litecoin is trading above its dot which makes today a bullish day. In addition, the current candle has already moved down to test support and confirmed. We then move down to the hourly chart to wait for entry signals for buying calls or opening long positions.
The chart below shows an asset already in rally mode, having bounced up from support. This move is confirmed by a strong entry signal in stochastic which is still on the rise and moving toward the upper signal line.
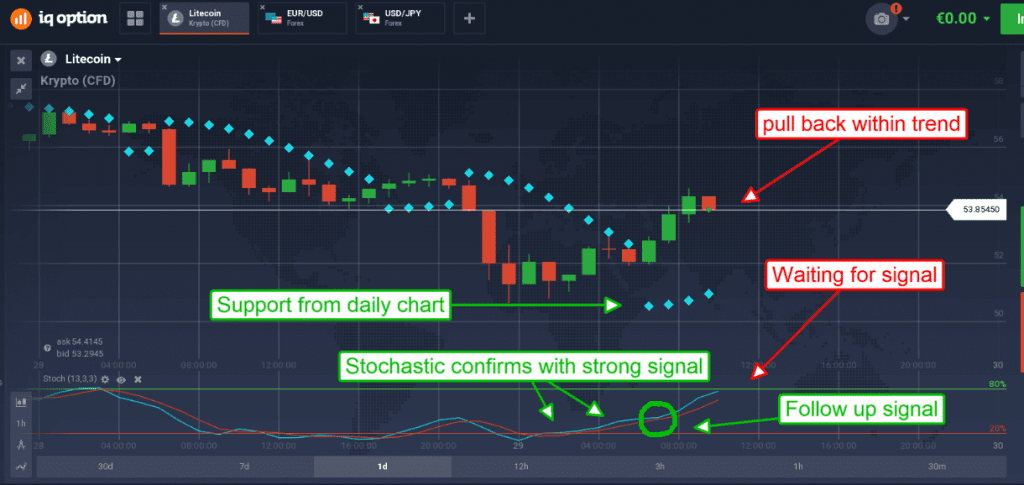
At this time the thing to do is wait for the next stochastic signal because there is already one in play, entry here is questionable. The next stochastic signal would be a bullish crossover or any dip of %K to test/bounce from %D. Bullish crossovers include %D crossing the upper signal line or %K dipping below and then crossing back above %D. The duration of the signal could be as short as 1 hour or as long as several days, depending on market conditions.
Register at Binance