Litecoin price is recovering higher from the $75.00 zone against the US Dollar. LTC could continue to rise if it clears the $84.00 resistance zone.
- Litecoin is showing positive signs from the $75 support zone against the US Dollar.
- The price is now trading below $85 and the 100 simple moving average (4 hours).
- There is a key bearish trend line forming with resistance at $83.00 on the 4-hour chart of the LTC/USD pair (data feed from Kraken).
- The price could gain bullish momentum if it clears the $83-$84 resistance zone.
Litecoin Price Aims Higher
After a steady decline, Litecoin found support near the $75.00 resistance zone, like Bitcoin and Ethereum. LTC price started a recovery wave above the $78.00 and $80.00 resistance levels.
It even cleared the 50% Fib retracement level of the downward move from the $88.49 swing high to the $74.59 low. The bulls even pumped the price above $82.00, but the bears were active near the 100 simple moving average (4 hours).
There is also a key bearish trend line forming with resistance at $83.00 on the 4-hour chart of the LTC/USD pair. Litecoin is now trading below $85 and the 100 simple moving average (4 hours).
On the upside, immediate resistance is near the $83.00 zone or the 61.8% Fib retracement level of the downward move from the $88.49 swing high to the $74.59 low. The next major resistance is near the $84 level. If there is a clear break above the $84 resistance, the price could start another strong increase.
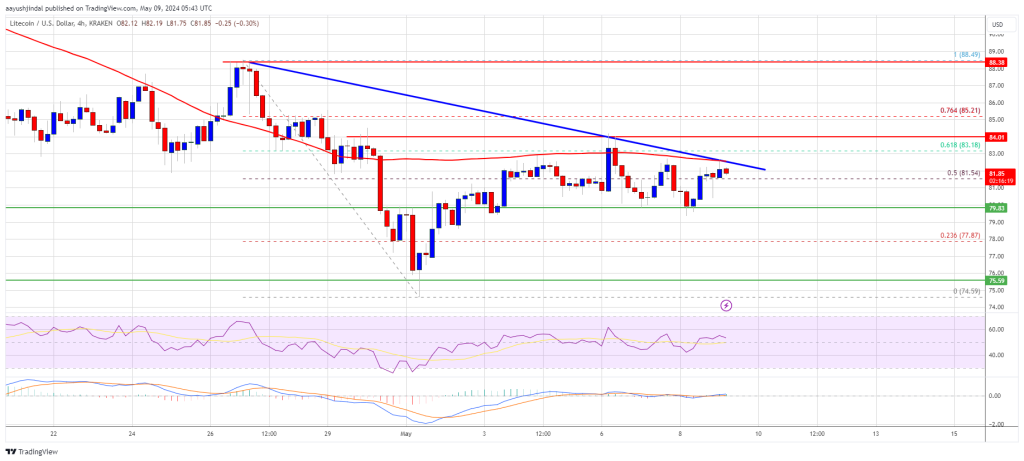
Source: LTCUSD on TradingView.com
In the stated case, the price is likely to continue higher toward the $88.50 and $90.00 levels. Any more gains might send LTC’s price toward the $95.00 resistance zone.
Are Dips Supported in LTC?
If Litecoin price fails to clear the $84 resistance level, there could be a downside correction. Initial support on the downside is near the $80.00 level.
The next major support is forming near the $77.80 level, below which there is a risk of a move toward the $75.00 support. Any further losses may perhaps send the price toward the $70.00 support.
Technical indicators:
4-hour MACD – The MACD is now gaining pace in the bullish zone.
4-hour RSI (Relative Strength Index) – The RSI for LTC/USD is above the 65 level.
Major Support Levels – $80.00 followed by $77.80.
Major Resistance Levels – $83.00 and $84.00.
Disclaimer: The article is provided for educational purposes only. It does not represent the opinions of NewsBTC on whether to buy, sell or hold any investments and naturally investing carries risks. You are advised to conduct your own research before making any investment decisions. Use information provided on this website entirely at your own risk.
Register at Binance