SUMMARY
- Understanding the Zone Recovery System
- Unpacking the Recovery Zone Concept
- The mathematics behind
- How the indicator works
- The “Analyze just one signal system”
- Real-time backtest of parameters
- Some insights about the Recovery Zone trade system
- Conclusion
1. Understanding the Zone Recovery System
The Zone Recovery system is a trading strategy designed to mitigate losses and capitalize on volatile market conditions. Unlike traditional methods that rely solely on predicting market direction, this system focuses on recovering from unfavorable price movements within a predefined “recovery zone” and potentially turn losing trades into winners.
2. Unpacking the Recovery Zone Concept
The recovery zone is a critical component of the Zone Recovery system. It represents a range of prices within which the system aims to recover from adverse movements without incurring substantial losses. For example, if a trade goes against you, the system will initiate additional trades in the opposite direction within the recovery zone to offset potential losses. In short, this trading system is a strategy designed to recover losses from losing trades by utilizing hedging techniques. The idea revolves around the concept of this “recovery zone,” where trades are strategically placed to ensure that the losses from the initial trades are recovered once the market moves in the opposite direction. In a nutshell, the system aims to turn losing trades into profitable ones through a series of strategic moves.
3. The mathematics behind
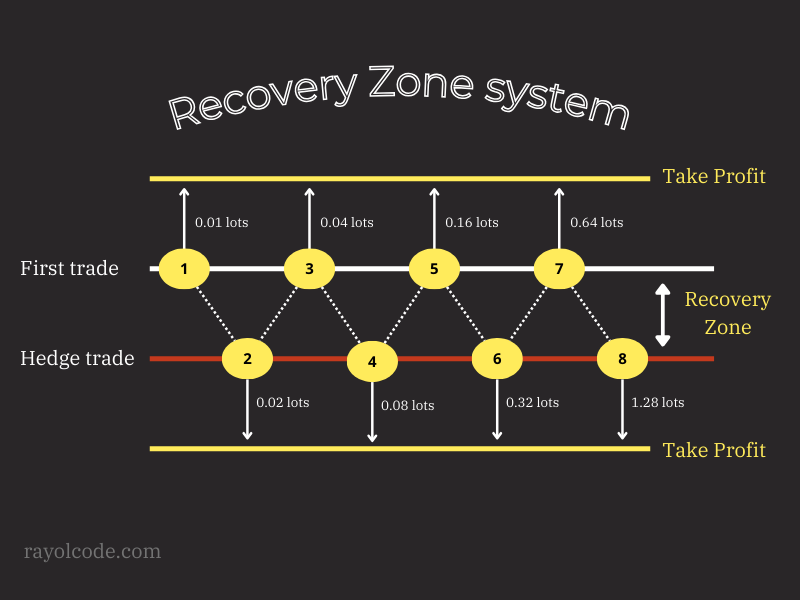
The mathematics involved in the Zone Recovery trading system can be a bit complex, but I will simplify it as much as possible for you. When a trade is opened, it is initially expected that it will make a profit, however, if that trade moves in the opposite direction to the take profit and starts to incur a loss, the traditional approach would be to close that trade by setting a fixed or financial stop loss. However, in the Recovery Zone system, instead of closing the transaction in loss and, therefore, causing a reduction to the account balance, the user opens a trade in the opposite direction to the initial trade so that the loss remains “locked ” and forming a kind of “loss zone” or Recovery Zone.
From now on, if this second trade does not reach the corresponding take profit level and returns to the price of that initial trade, a third trade must be opened in the direction of initial trade with a corresponding lot so that when the take profit is reached, either all positions are closed at breakeven or with a profit, as we can see in the image above. That is, this process continues until market movement allows cumulative trades to break even or generate a profit.
Therefore, the worst scenario for this system is exactly one in which the price remains sideways for a long time and takes a long time to decide to take a definitive direction. To successfully implement this system, it is crucial to understand risk management and position sizing, as well as using a distance to the Recovery Zone compatible with the timeframe and expected volatility in the traded asset. The key to utilizing the Zone Recovery strategy effectively is to ensure that subsequent trades are calculated based on the lot size of the initial trade and the recovery factor determined by the trader’s risk tolerance.
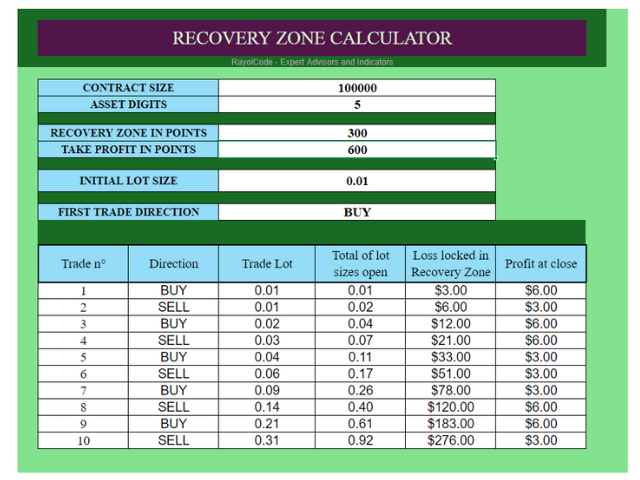
In order to facilitate the process of calculating and compressing the lot sizes required for each new entry into the Recovery Zone, I provide a calculator on my website that you can access by clicking the image of the calculator below:
4. How the indicator works
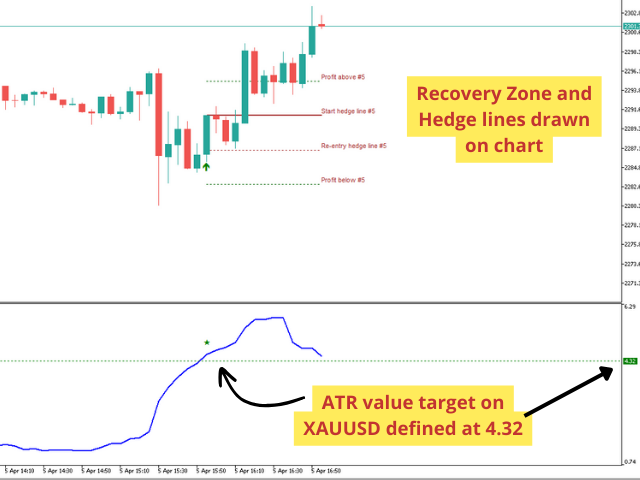
This indicator allows you to define 3 operating modes in relation to the ATR behavior. For example, the first mode is to define a target value for the ATR, so that when it is reached, the indicator informs you of this.
Likewise, by default, the indicator also draws four lines on the active chart:
1. the entry zone of the initial trade;
2. the re-entry or hedge zone for trades contrary to the direction of the initial trade;
3. finally, the two take profit zones above and below the trade opening zones, as seen in the image below.
The other two operational modes are to set the indicator to inform when the ATR prints a percentage increase in value in relation to the last x candles defined by the user or the opposite, when the ATR prints a percentage reduction in value in relation to the last x candles defined by the user.
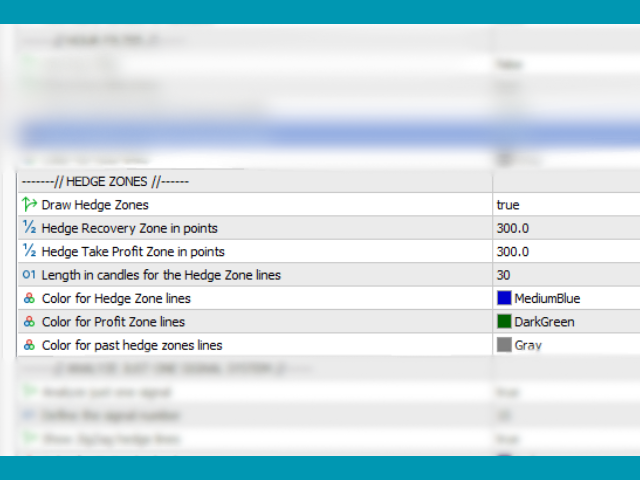
On the “Hedge Zones” parameters you can define the distance in points for the Recovery Zone and also the distance in points for the Take Profit levels. By setting these, the indicator will draw these areas in the chart everytime a new signal occurs.
5. The “Analyze just one signal system”
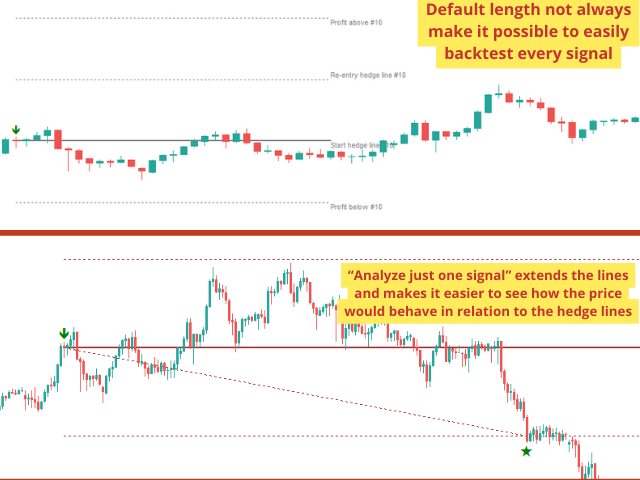
By default, zone lines are 30 candles long. This is to prevent horizontal lines of infinite length from filling the graph, making it impossible to read. However, it is worth noting that the user can increase the length of these lines if they wish.
In any case, this indicator allows the user to analyze each desired signal in isolation. By doing this, the lines of this specific signal are extended and understanding what movement the price would have made within these defined lines becomes extremely practical and safe, as demonstrated in the image below.
6. Real-time backtest of parameters
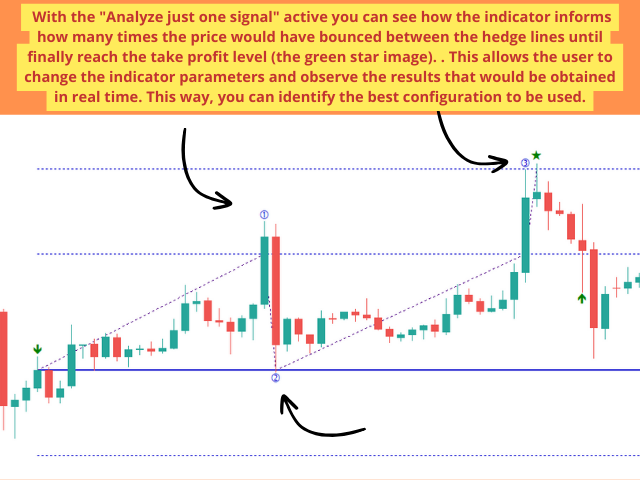
The “Analyze just one signal” function not only allows the Recovery Zone lines and hedge levels to be extended, but also offers the user the possibility of knowing how many times the price would have reached the re-entry zones in order to be It is possible to optimize which parameters are safer and more profitable for the trader. It is worth saying, the less frequently the price triggers new trade entries and also the smaller the total number of open lots, the better this strategy is for the trader.
You will notice that you simply need to change the distances to the Recovery Zone and the Take Profit levels in real time and the indicator will immediately inform you how many times the price would have reached the re-entry zones before finally reaching a Take Profit zone.
7. Some insights about the Recovery Zone trade system
Using the Recovery Zone calculator available for free, as well as the search for the best distance parameters for the Recovery Zone and the Take Profit zones, it is clear that using a very narrow size for the Recovery Zone causes the successive and dangerous opening of several trades, with the consequent accumulation of lot sizes that can eventually cause serious damage to the account balance.
Therefore, the ideal is to find a distance value for the Recovery Zone that avoids excessive opening of orders in sequence, but also allows the distance for the Take Profit levels to never be lower than the distance defined for the Recovery Zone itself, from the Otherwise, lot sizes will increase exponentially, which is not desired.
For example, defining a Recovery Zone of 300 points, but with Take Profit levels with twice as many points, that is, with 600 points, makes the system much more profitable and economical from the point of view of increasing lots than using values identical or very close to the distances of the Recovery Zone and the Take Profit zones.
Below, we will analyze the lots that should be opened using identical values for the Recovery Zone and Take Profit levels.
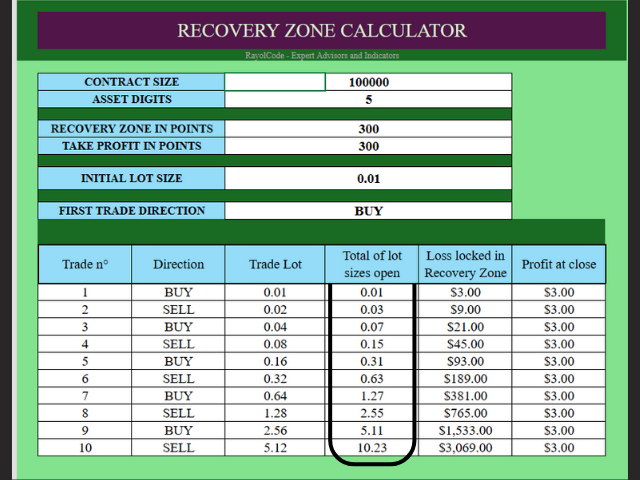
As you can see above, upon reaching the tenth trade the account would already be accumulating a total volume equivalent to 10.23 open lots, which would cause an Equity Loss of $3,069.00. Now let’s see a different scenario using a distance equal to twice that used for the Recovery Zone for the Take Profit levels.
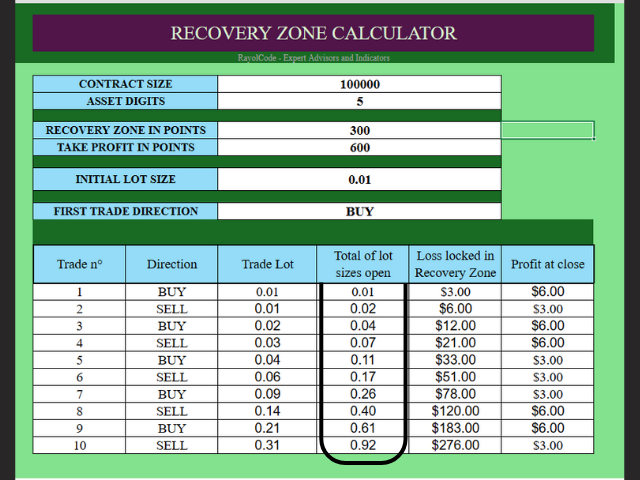
Now, the total volume of open lots corresponds to 0.92, a significantly lower amount than in the previous scenario. Likewise, the Equity Loss is now just 276 dollars, much lower than the previous 3069 dollars.
8. Conclusion
It is possible to conclude that the Recovery Zone trading system is a valid way of operating financial assets, however some details need to be observed:
1. Sideways assets or assets that usually vary very little daily are not suitable for this type of strategy;
2. Finding values for the distances of the Take Profit zones greater than the distance used in the Recovery Zone itself offers a greater margin of operational safety to the trader;
3. Using the RC ATR Volatility Hedge Zones indicator, it is much simpler and safer to open trading positions exactly in scenarios of strong asset volatility, maximizing the success rate of this system.
You can find this indicator below:
FOR METATRADER 5: CLICK HERE
FOR METATRADER 4: CLICK HERE
Register at Binance